Introducing Performance Test for MinIO


MinIO is a high-performance and highly scalable distributed object storage solution that runs directly on bare metal or as a Kubernetes-native plugin. Customers frequently cite MinIO’s industry-leading performance as one of its most differentiated features. We recently added support for automated performance testing, and wanted to share the news.
At MinIO, we’re focused on performance and simplicity. The new Performance Test functionality gives storage admins the ability to enjoy both. With a single command, admins can run a distributed performance assessment of their entire MinIO cluster. Results can be used to track performance over time and proactively pinpoint potential problems before they grow into serious issues.
This post shows you how to conduct a quick performance assessment of your MinIO cluster using mc support perf or the MinIO Console.
Benefits of Performance Test
Applications access MinIO clusters via HTTP/S and an AWS S3-compatible RESTful API. We developed the open source WARP S3 benchmarking tool to measure GET and PUT performance from one or more clients to one or more hosts. While WARP is a complete benchmarking tool, in our quest for simplicity, we wanted to provide a straightforward tool that is easy to run and provides easy-to-interpret results quickly. We developed Performance Test to streamline and automate performance testing so you can proactively identify potential trouble-spots before they cause bottlenecks.
To help you make the most of MinIO performance, we’ve put together a few resources. You can get started with reference hardware and recommended configuration, and learn how to plan and deploy MinIO in distributed mode to optimize performance.
How to Measure MinIO Cluster Performance
Let’s say you have a small MinIO cluster that’s available to applications and you want to verify that you’re getting optimal performance out of your object storage layer. This includes a quick check on your MinIO cluster’s overall health followed by running Performance Test.
Performance Test runs PUTS, then GETS, then collects information and presents aggregated throughput results for a cluster.
1 Getting Cluster Status
Open a Terminal and use MinIO Client to run mc admin info alias to display information about a MinIO cluster or individual server. Replace alias with the alias for the MinIO cluster you wish to test.
$ mc admin info min
●  all-nodes-pool-0-0.all-nodes-hl.ns-1.svc.cluster.local:9000
   Uptime: 2 days
   Version: 2021-11-09T03:21:45Z
   Network: 6/6 OK
   Drives: 10/10 OK

●  all-nodes-pool-0-1.all-nodes-hl.ns-1.svc.cluster.local:9000
   Uptime: 2 days
   Version: 2021-11-09T03:21:45Z
   Network: 6/6 OK
   Drives: 10/10 OK

●  all-nodes-pool-0-2.all-nodes-hl.ns-1.svc.cluster.local:9000
   Uptime: 2 days
   Version: 2021-11-09T03:21:45Z
   Network: 6/6 OK
   Drives: 10/10 OK

●  all-nodes-pool-0-3.all-nodes-hl.ns-1.svc.cluster.local:9000
   Uptime: 2 days
   Version: 2021-11-09T03:21:45Z
   Network: 6/6 OK
   Drives: 10/10 OK

●  all-nodes-pool-0-4.all-nodes-hl.ns-1.svc.cluster.local:9000
   Uptime: 2 days
   Version: 2021-11-09T03:21:45Z
   Network: 6/6 OK
   Drives: 10/10 OK

●  all-nodes-pool-0-5.all-nodes-hl.ns-1.svc.cluster.local:9000
   Uptime: 2 days
   Version: 2021-11-09T03:21:45Z
   Network: 6/6 OK
   Drives: 10/10 OK

60 drives online, 0 drives offline
We see that our cluster servers and drives are fully operational.
2 Running Performance Test
Run Performance Test in autotune mode. Performance Test runs, incrementally increasing load to pinpoint maximum aggregate throughput.
$ mc support perf alias
The test will run and present results on screen. The test may take anywhere from a few seconds to several minutes to execute depending on your MinIO cluster. The flag -v indicates verbose mode.
MinIO 2021-10-10T16:53:30Z, 4 servers, 40 drives

PUT: 20 GiB/s, 161 objs/s
   * http://data1:9000:, 5.0 GiB/s, 40 objs/s
   * http://data2:9000:, 5.2 GiB/s, 41 objs/s
   * http://data3:9000:, 4.9 GiB/s, 39 objs/s
   * http://data4:9000:, 5.1 GiB/s, 40 objs/s

GET: 37 GiB/s, 295 objs/s
   * http://data1:9000:, 9.7 GiB/s, 77 objs/s
   * http://data2:9000:, 9.3 GiB/s, 74 objs/s
   * http://data3:9000:, 8.5 GiB/s, 67 objs/s
   * http://data4:9000:, 9.5 GiB/s, 75 objs/s
Running Performance Test in MinIO Console
It is also be possible to run Performance Test from MinIO Console, the browser-based graphical interface for configuring, managing and reporting on MinIO clusters.
In the navigation bar along the left, scroll down to Subscription, click to show Support options, then click Performance.

If you have not registered your MinIO cluster, you will be prompted to do so before running a Performance Test.

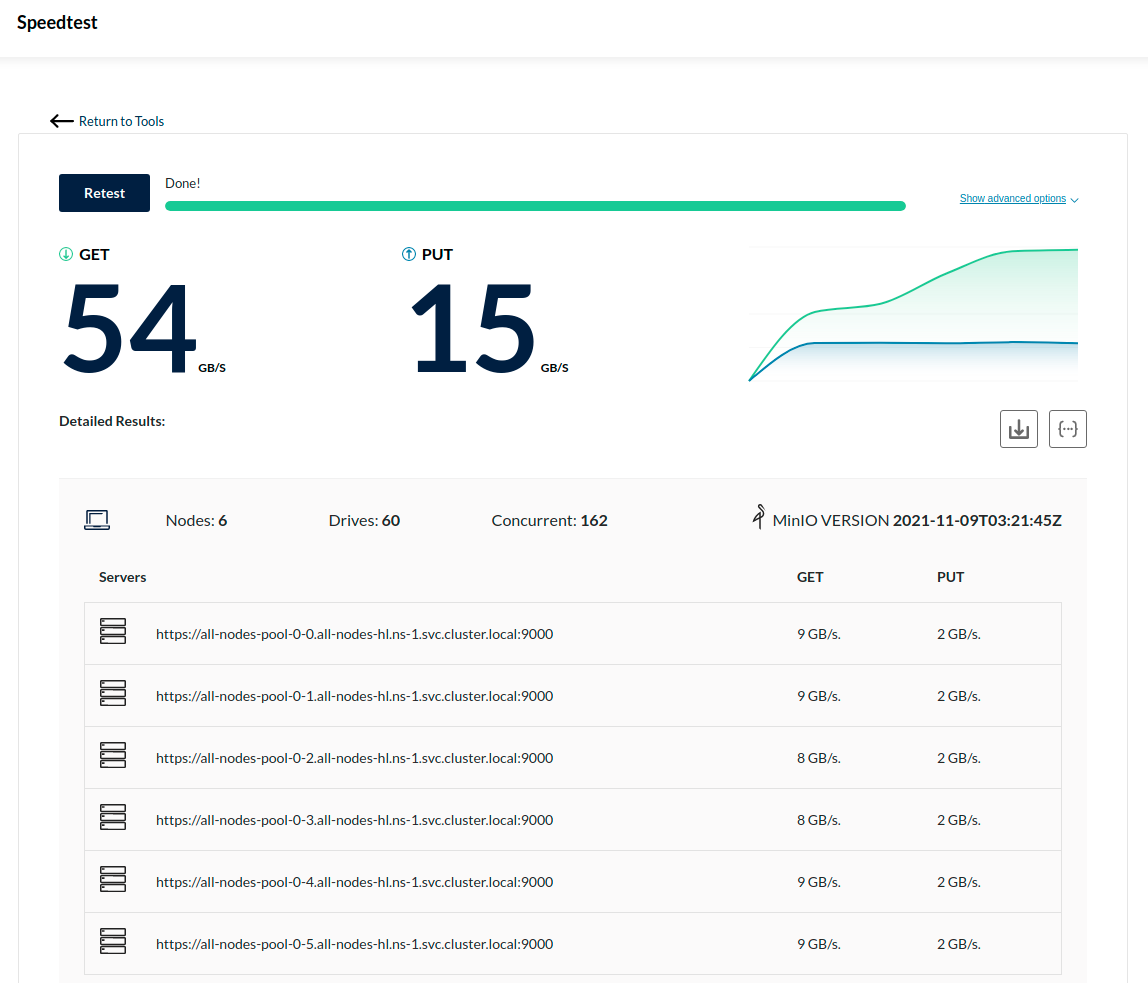
Click Start to run a test, or click Show advanced settings to customize the duration, object size and number of concurrent requests and then click Start.
Performance Test results are displayed for the entire cluster as well as for individual nodes.
It’s Test Time!
We’re dedicated to building high-performance object storage and providing the tools you need to keep it running in top shape. Now you can assess cluster performance with one command.
You don’t have to be a performance expert to get the most out of MinIO. Companies that subscribe to SUBNET can share results with us to have them reviewed by MinIO engineers. SUBNET combines a commercial license (important for the AGPLv3 obligations) with a unique support model that delivers 24/7/365 direct-to-engineer support through a MinIO-built portal that blends the best of Slack and Zendesk into an issue-resolving machine. Performance Test can be run in conjunction with SUBNET Health, an automated troubleshooting tool that runs dozens of checks on your MinIO instance to ensure it is running properly.
You can try this out by downloading MinIO. If you’d like to know more or have any questions, join our Slack Channel or drop us a note at hello@min.io.