A Log Observability Stack for the Cloud Native Era

Logging platforms help you get deeper insights in your software infrastructure and see how things are actually working. However, traditional logging infrastructure is bloated and needs a great deal of effort to even get to a running state.
The collection, aggregation and analysis of logs from cloud native infrastructure and applications is an essential operational component of IT and DevOps teams. As microservices proliferate and the number of operating locations grows, the number of logs increases dramatically. Not only that, every infrastructure layer and service has its own logs.
The result is that troubleshooting has gone from inspecting a few TBs to several PBs (depending on the application infrastructure size) to pinpoint errors.
Kubernetes by design left native support for cluster level logging to external platforms because of the sheer scale and complexities involved. However current solutions are just not enough for the large-scale log data that containerized environments generate.
In this post, we’ll look into setting up a logging stack that can help you unify logs from your Kubernetes infrastructure within minutes. The whole stack is JVM free which means fewer knobs to turn and a reliable, smooth experience for day 2 operations.
We’re going to use MinIO and Parseable to build our lean logging stack. Parseable is a lightweight, low-latency logging and observability tool for cloud native applications. MinIO is a high performance object storage system that was built from scratch to be performant, scalable and cloud-native. As the world’s fastest object store, MinIO is perfectly suited to store large volumes of log files and expose them via an API for analytics and ML/AI processing.
Pre-requisites
- Kubernetes cluster up and running. Version 1.19 and above.
kubectlinstalled and configured to point to your Kubernetes cluster.krewinstalled
Set up MinIO
MinIO serves as the backbone of this whole setup. It serves as the high performance, persistent storage layer for the log data sent by Parseable. All the log data written by Parseable is saved in Parquet, so you can use other data analytics tools from the Apache / Parquet ecosystem to analyze this data.
Set up MinIO Operator
MinIO Kubernetes Operator is the recommended approach for MinIO production deployments on Kubernetes. Follow the below steps to set up a development instance on your Kubernetes cluster. For a high-availability production MinIO deployment, please refer to the Kubernetes docs.
- Install the
kubectl minioplugin. This plugin allows native command line access to the MinIO Operator.
kubectl krew update
kubectl krew install minio
2. Create a MinIO Operator instance.
kubectl minio init3. You should now see the operator and console pods along with services, in a running state. Check the status with the below command.
kubectl get all -n minio-operatorCreate a MinIO Tenant
Let's create a MinIO Tenant now. We’ll use this tenant as the storage target for Parseable log data. Follow the below steps to create a MinIO tenant.
Kubectl create ns tenant1
kubectl minio tenant create tenant1 --servers=1 --volumes=4 --capacity=4Gi --enable-prometheus=false --enable-audit-logs=false --disable-tls -n tenant1
kubectl minio tenant info tenant1
The kubectl minio tenant create command prints the admin credentials for this tenant. They will not be shown again. Note these down, we’ll use them in the next step.
Next, let’s expose the MinIO console to your local machine, so we can access the UI. Note that in some cases, you might have to use ingress-nginx to access the service.
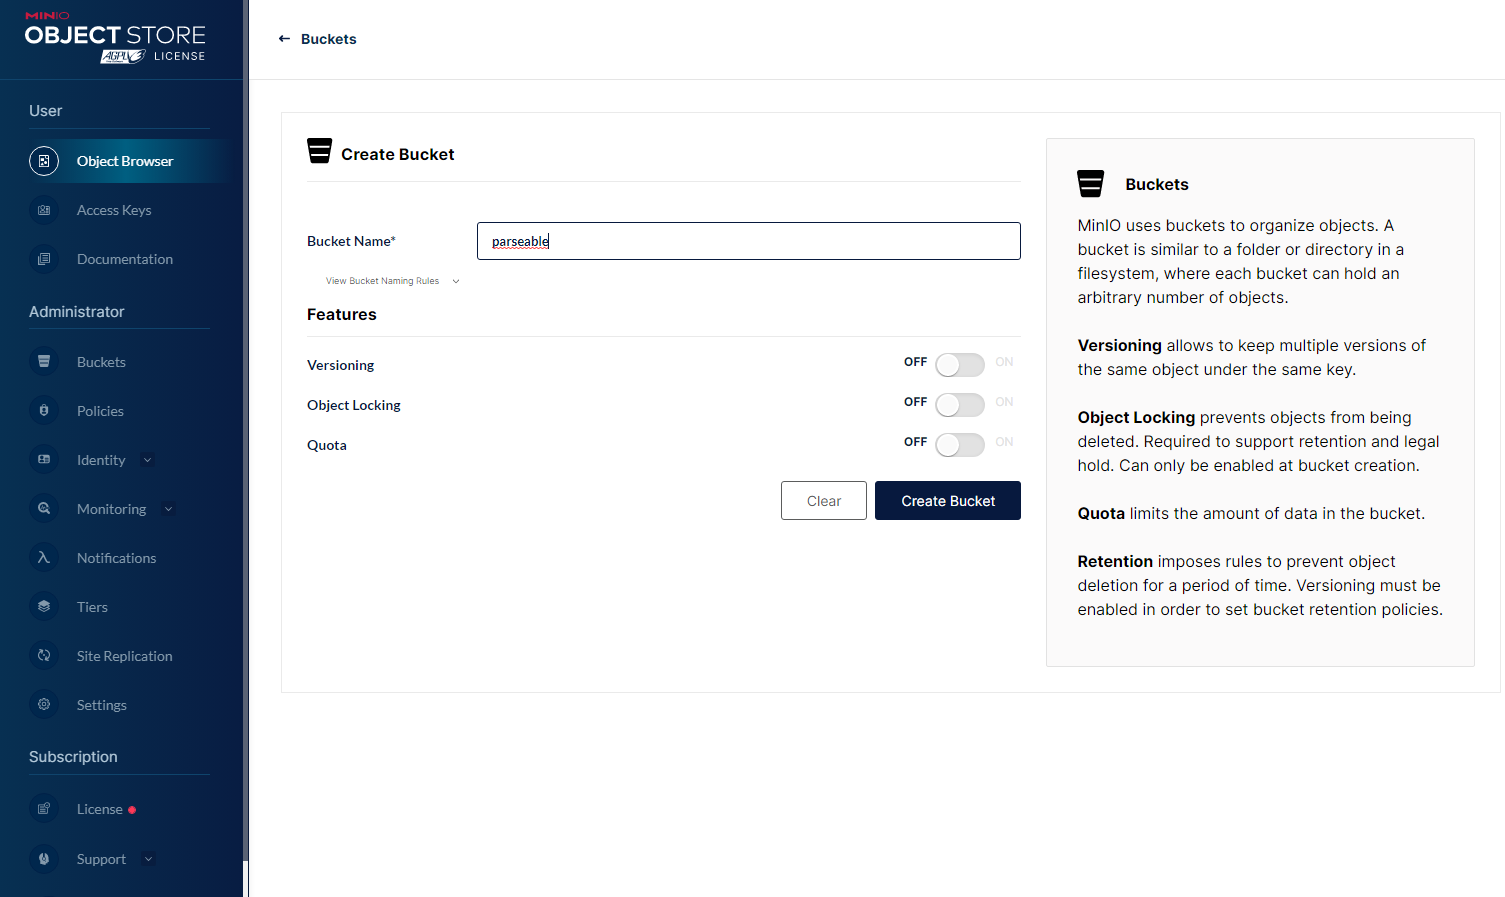
kubectl port-forward svc/tenant1-console 9090:9090 -n tenant1Now, open a browser and visit the URL http://localhost:9090. Login with the credentials printed by the kubectl minio tenant create command. Navigate to create a bucket and make a bucket called parseable.
Set up Parseable
Once MinIO is set up and running, the next step is to set up Parseable. We’ll deploy Parseable in s3-store mode, so it uses MinIO as primary storage.
First, create a file with the environment variables required for Parseable. Make sure to update the access key and secret key from previous steps. Below, we have created the file parseable-env-secret
cat << EOF > parseable-env-secret
s3.url=http://minio.tenant1.svc.cluster.local
s3.access.key=<tenant1 access key>
s3.secret.key=<tenant1 secret key>
s3.region=us-east-1
s3.bucket=parseable
addr=0.0.0.0:8000
staging.dir=./staging
fs.dir=./data
username=admin
password=admin
EOF
Next, create the Parseable namespace and a secret to be used by Parseable deployment.
kubectl create ns parseable
kubectl create secret generic parseable-env-secret --from-env-file=parseable-env-secret -n parseable
rm -rf parseable-env-secret
Finally, deploy the Parseable helm chart.
helm repo add parseable https://charts.parseable.io
helm install parseable parseable/parseable -n parseable
Set up Vector
This brings us to the last step of this tutorial. Vector is a lightweight, ultra-fast tool for building observability pipelines. It can push logs and telemetry events from a Kubernetes cluster via its native Kubernetes sink.
First, add the Vector helm repo and download the Parseable configured values.yaml file.
helm repo add vector https://helm.vector.dev
wget https://www.parseable.io/vector/values.yaml
Then install Vector in its own namespace.
helm install vector vector/vector --namespace vector --create-namespace --values values.yamlIn default configuration, Vector gets installed as a DaemonSet, and captures logs from each Pod. Read more on Vector Kubernetes source documentation.
Vector will take a minute or two to initialize. You can view the Vector dashboard to make sure it is running correctly.
kubectl -n vector exec -it daemonset/vector -- vector top \
        --url http://127.0.0.1:8686/graphql
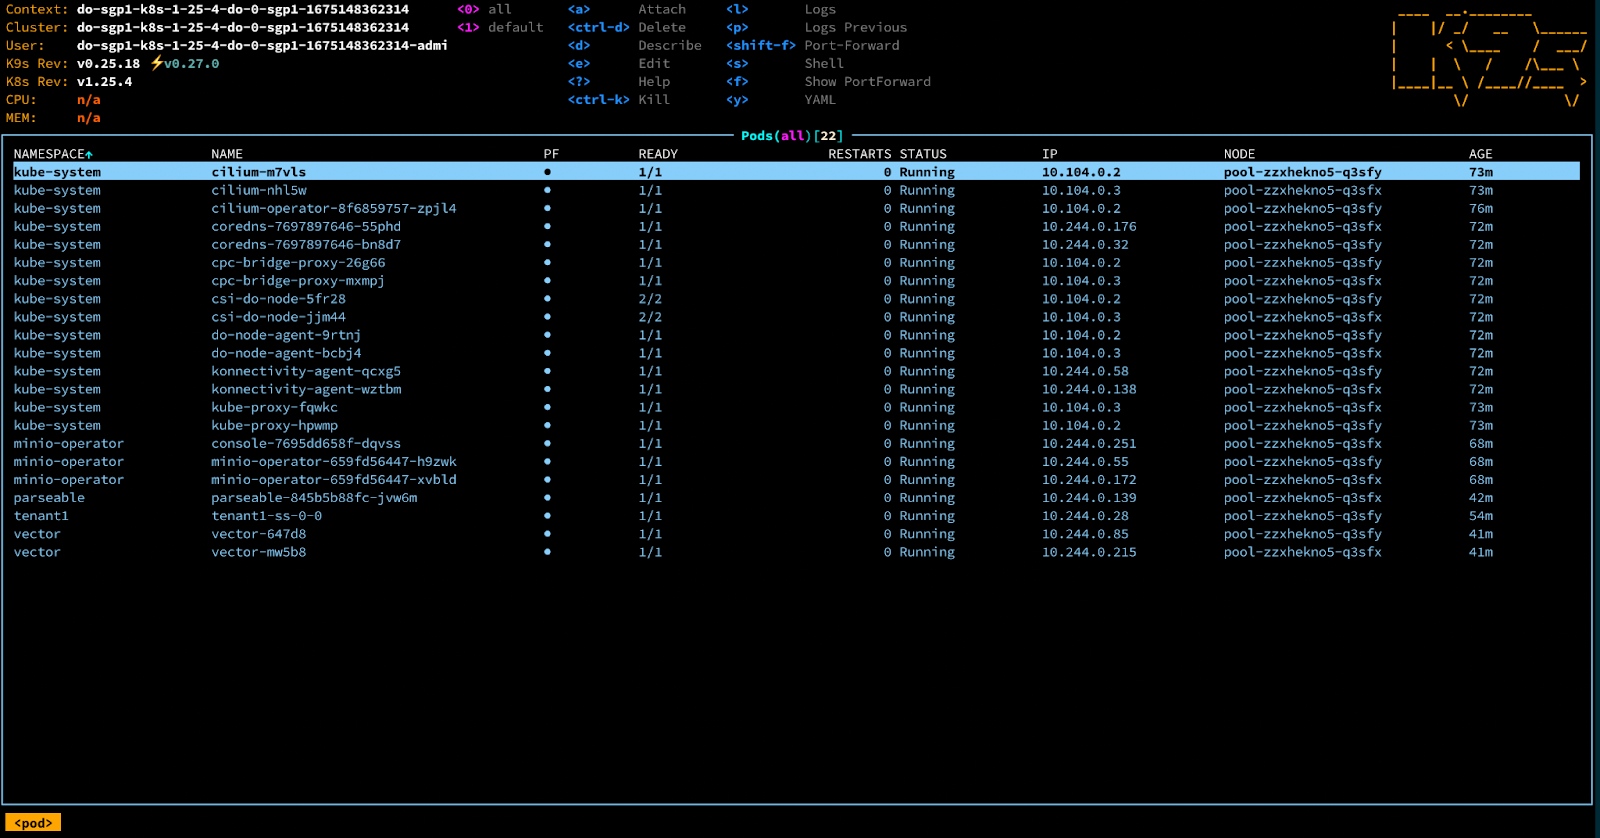
With everything running as expected, you should have these pods running:
Test if it all works
Since we configured Vector to collect logs from all the pods, it will immediately start sending pod logs to the Parseable stream k8slogs (set in the Vector values.yaml).
To verify, expose the Parseable service to a local machine and log in to the Parseable UI with the credentials set in the Parseable secret we created earlier (if these aren’t configured, the default is admin and admin).
kubectl port-forward svc/parseable 8000:80 -n parseable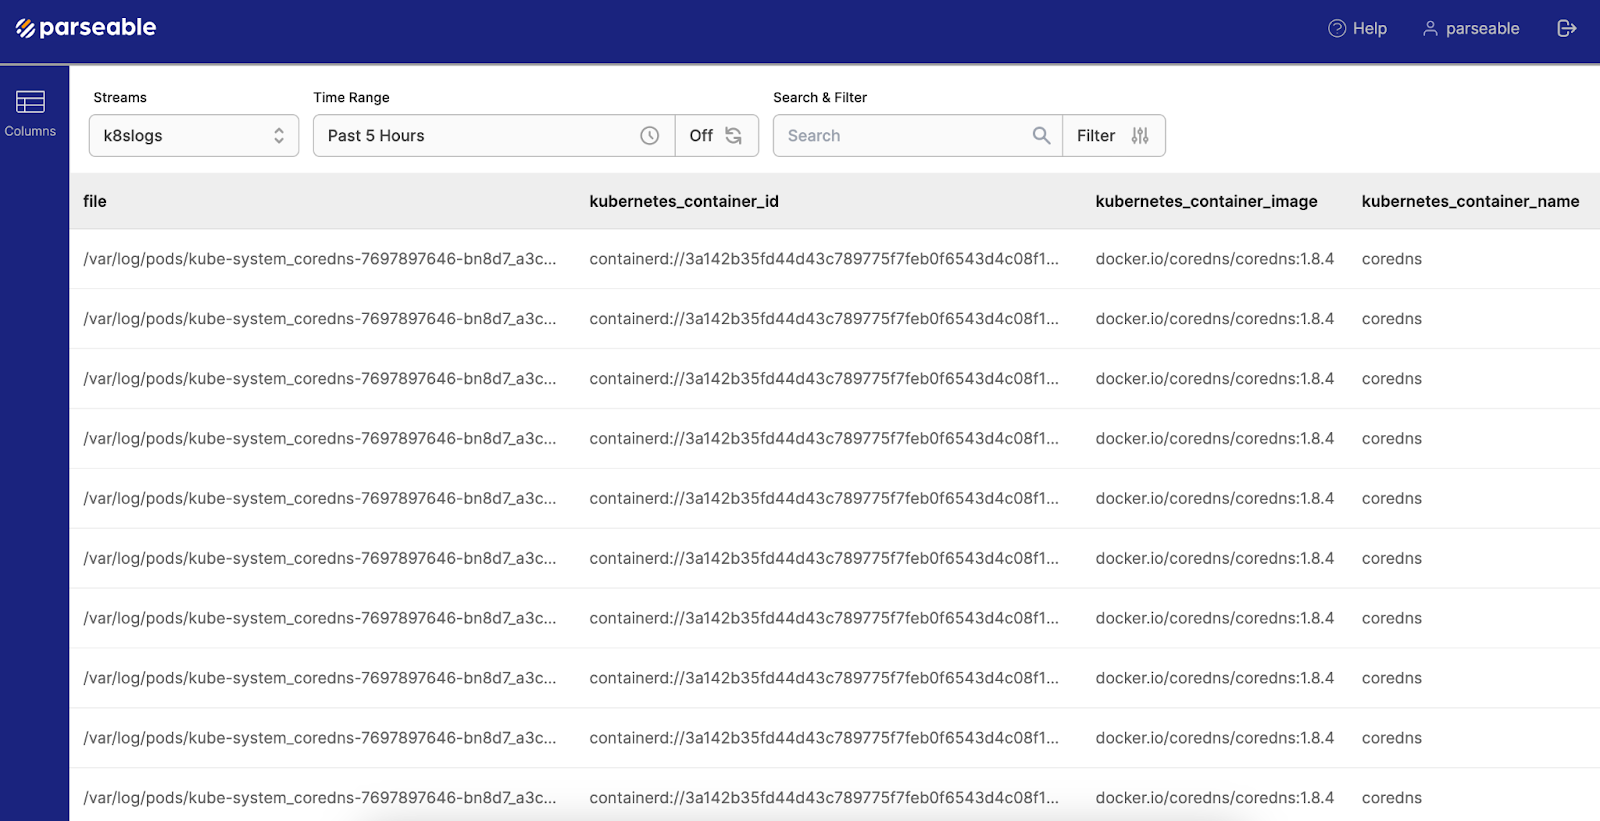
Log Analysis
Now that we’ve got the whole setup working, let’s take a look at how to analyze log data with simple SQL queries and even build dashboards with the Parseable + Grafana datasource plugin.
SQL Query
Ensure you have the kubectl port-forward for Parseable running in a terminal. Then use curl in another terminal to send a query like this
curl --location --request POST 'http://localhost:8000/api/v1/query' \
--header 'Authorization: Basic YWRtaW46YWRtaW4=' \
--header 'Content-Type: application/json' \
--data-raw '{
    "query":"select * from k8slogs where kubernetes_container_name=’coredns’",
    "startTime":"2023-02-08T00:00:00+00:00",
    "endTime":"2023-02-08T23:59:00+00:00"
This query will show all the logs from all pods that are running a CoreDNS container. You can run standard SQL queries this way to slice and dice the logs in the k8slogs stream.
NOTE: Make sure to change the startTime and endTime to appropriate time stamps. Also update the Authorization header in case you changed the Parseable credentials above.
Visualization
We’re hard at work to bring visualization to the Parseable console, but while we work on that, we currently recommend our Grafana datasource plugin.
If you don’t already have Grafana installed, then please see Multi-Cloud Monitoring and Alerting with Prometheus and Grafana for a baremetal installation or Deploy on Kubernetes | Grafana Enterprise Logs documentation for a Kubernetes installation. If you already have Grafana installed, you can install the Parseable plugin from Grafana Marketplace or use the grafana-cli command:
grafana-cli plugins install parseable-datasourceOnce the plugin is installed, add a Parseable data source Configuration > Data sources > Add Data source. Then create a new dashboard with the Parseable datasource as the source. This is how the query editor looks when using the Parseable datasource:

You can add your SQL query in the text box. Grafana takes care of adding relevant timestamps. Here is a sample visualization:
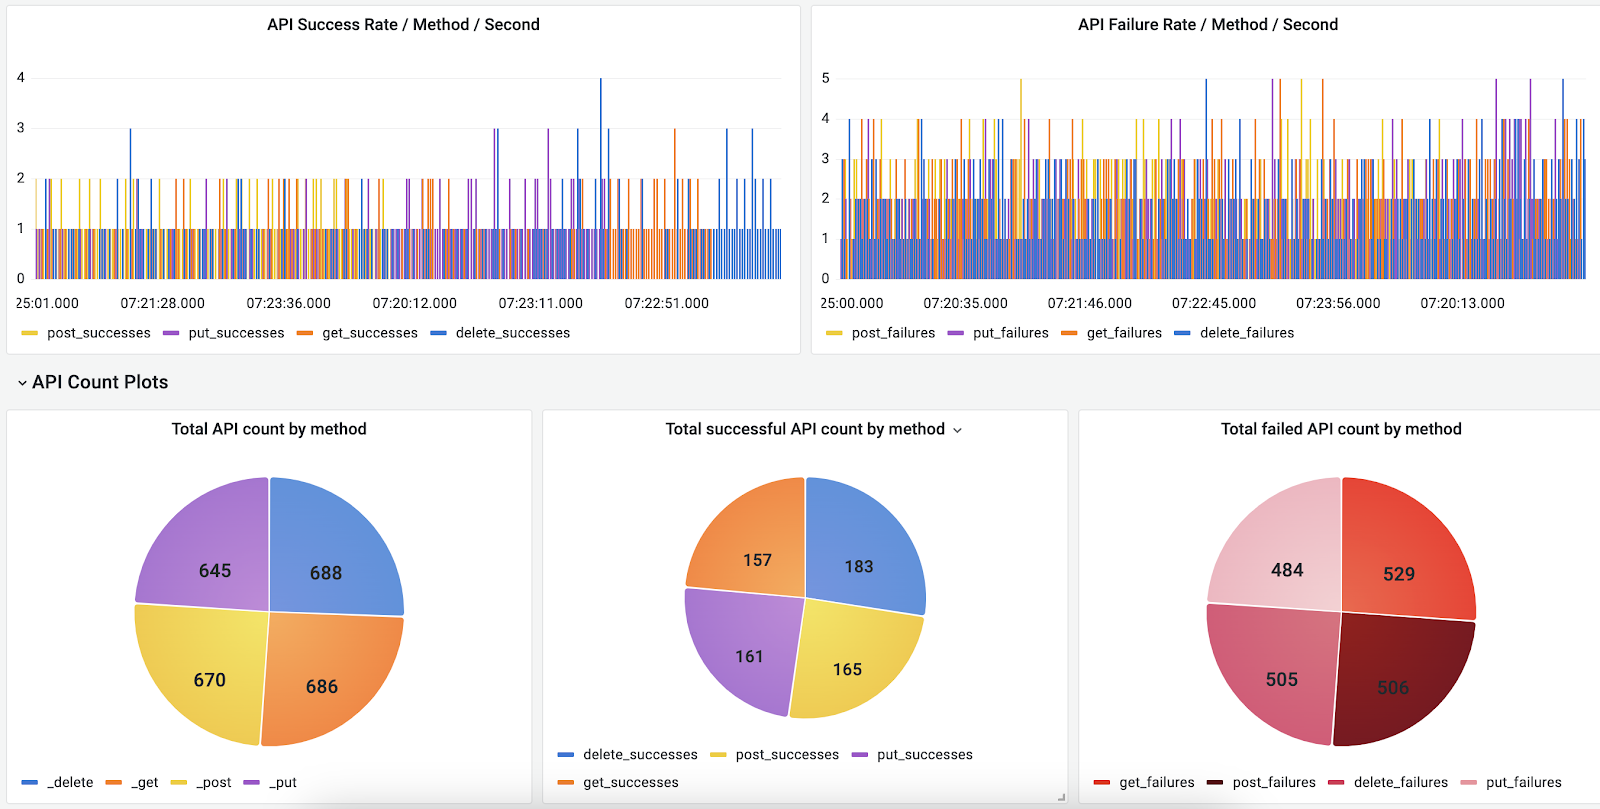
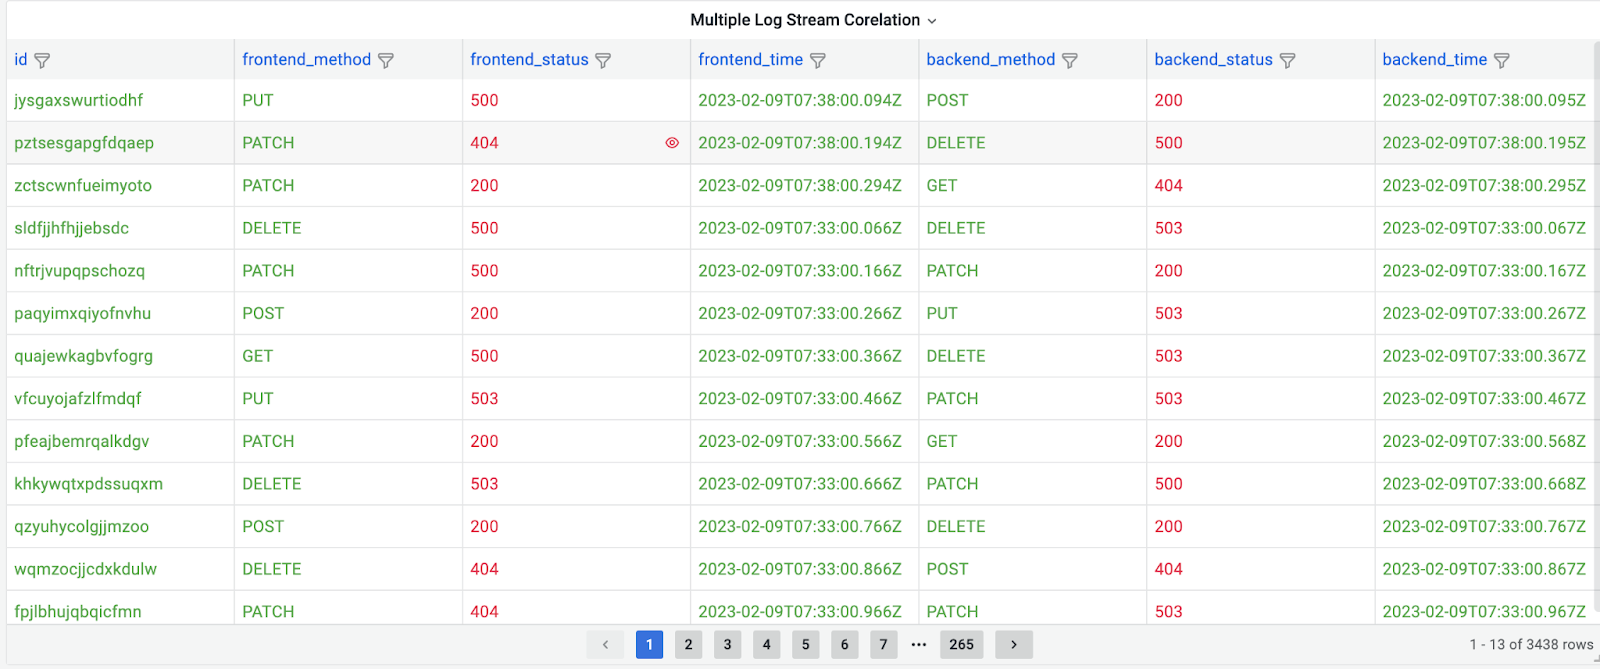
You can also correlate logs from different log streams using the transforms option.
Conclusion
This blog post showed you how to build a cloud native logging stack with MinIO and Parseable.
Logs from cloud native infrastructure and applications provide critical troubleshooting information to IT and DevOps teams. When you run a multitude of microservices on software-defined infrastructure, everything has its own log so you need a viable way to collect and search logs in a timely manner.
The techniques that we demonstrated in this blog post will help you unify log collection, aggregation, management and analysis to understand cluster operation and performance in real time.
If you have questions about cloud native logging, please join our community Slack channels at https://slack.min.io and https://launchpad.com/parseable.


