Scaling MinIO: Benchmarking Performance From Terabytes to Petabytes

MinIO provides the best-in-class performance as we have repeatedly shown in our previous benchmarks. In those benchmarks, we chose the highest-end hardware and measured if MinIO could squeeze out every bit of the resources afforded it. This proved two key points:
- Ensuring that MinIO utilizes the maximum possible CPU, Network, and Storage available.
- Ensuring that MinIO is NOT the IO-bottleneck.
Having achieved proof points on the above, we turned our attention to measuring the behavior of MinIO along another equally important dimension:
- Ensuring that MinIO’s performance does not degrade as we increase the cluster size.

The chart above depicts the linear scalability of MinIO with a HDD Backend. The post covers HDD and NVMe and what we see in those cases.
Performance at Scale
In order to measure performance at scale, we performed separate sets of tests for NVMe and HDD backends. This is because NVMe Drives and Hard Disk Drives have different scaling dynamics and warrant separate measurements.
NVMe Backends: Scaling for Performance
The maximum sustained throughput of a single NVMe drive is ~3.5 GB/sec for reads and ~2.5 GB/sec for writes. This essentially means that only 4 NVMe drives are needed to saturate 16x PCIe 2.0 lanes (Maximum 16x PCIe 2.0 bandwidth is 8GB/sec)
In real-world scenarios, a variety of workloads simultaneously hitting the drives would justify a higher number of drives. As a rule of thumb, 8 NVMe drives per machine can be considered the point of diminishing returns.

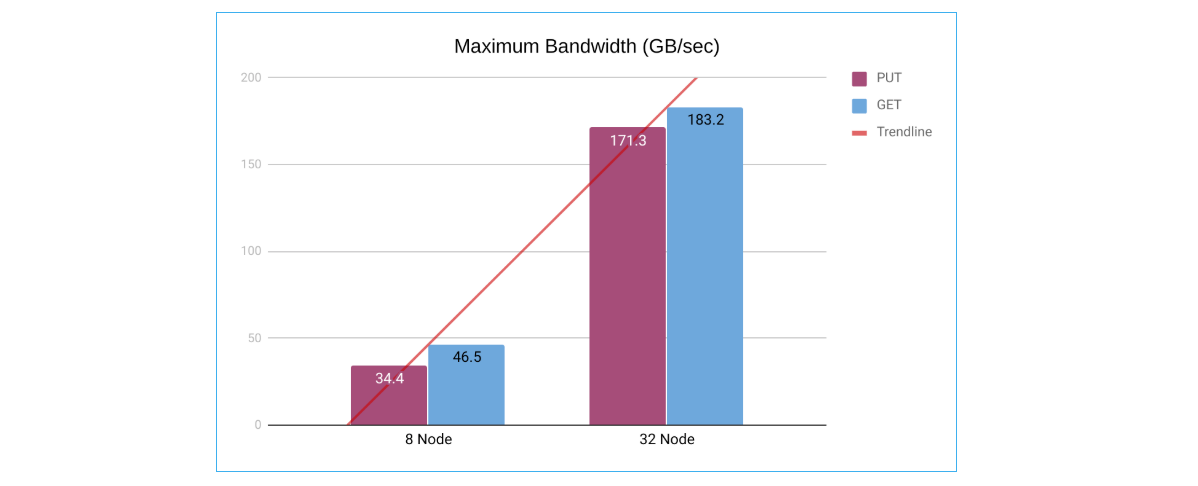
The chart above depicts the linear scalability of MinIO with NVMe Backend
The above-mentioned dynamics make NVMe backends a great choice for scaling workloads where maximizing throughput is the primary requirement.
We performed tests with 8 nodes and 32 nodes, each with 8 NVMe drives and 100 GBe Network. Each drive’s capacity was 8 TB. The total available storage was 512 TB (0.5 PB) and 2048 TB (2 PB).

As we increased the node count from 8 to 32, we noticed a near-linear (~4x) increase in Read performance.
Note: The PUT numbers seemingly indicate supralinear scalability. However, this is due to the variability of hardware performance on AWS. In the case of the 32 node tests, they were performed after AWS launched bare-metal NVMe instances (i3en.metal), which did not have this issue.
HDD Backends: Scaling for Storage Capacity
In contrast to NVMe drives, the maximum sustained throughput of a single Hard Disk Drive is ~250 MB/sec for both reads and writes. It takes approximately 32 HDDs working simultaneously at the highest performance to saturate 16x PCIe 2.0 lanes. An even larger number of drives can be justified per machine as randomness (multiple IO requests) rapidly degrades HDD performance.
HDDs enable higher storage capacity to be achieved with fewer servers as compared to NVMe backends as more drives can be packed into a single server. This makes HDD backends a great choice for scaling workloads where maximizing total storage capacity is the primary requirement.
We performed tests with 16 nodes and 24 nodes, each with 8 HDD drives and 25 GBe Network. Each drive’s capacity was 2 TB. The total available storage was 256 TB and 384 TB.

As we increased the node count from 16 to 24 (1.5x), we noticed a near-linear increase in Read performance. The increase in write performance was less than linear, likely due to increased random I/O caused by the sheer load on the drives from the benchmark tests. Please note that hardware performance showed slight variability in these AWS instances as well.
Conclusion
HDD backends are bound to provide better price, efficiency, and performance when scaling total storage space. NVMe backends are more suited for scaling maximum bandwidth available for clients to read and write data. In both cases, the maximum throughput scaled linearly as the cluster size was increased. If you have any questions, please reach out to me at sid@min.io


