Using InfluxDB with MinIO

As an engineer responsible for maintaining a stack, metrics are one of the most important tools for understanding your infrastructure. In the past, we’ve blogged about several ways you can measure and extract metrics from MinIO deployments using Grafana and Prometheus, Loki, and OpenTelemetry, but you can use whatever you want to leverage MinIO’s Prometheus metrics. We invite you to observe, monitor and alert on your MinIO deployment – open source MinIO is built for simplicity and transparency because that is how you operate at scale.
InfluxDB is built on the same ethos as MinIO. It is a single Go binary that can be launched in many different types of cloud and on-prem environments. It's very lightweight, but is also feature packed with things like replication and encryption, and it provides integrations with various applications. MinIO is the perfect companion for InfluxDB because of its industry-leading performance and scalability. MinIO has created a comprehensive blueprint for data infrastructure to support exascale AI and other large scale data lake workloads. It is called the MinIO DataPod. Why? Because exascale data is the reality that is common today in today's enterprise – and is used to build data lakes/lake houses and analytics and AI/ML workloads. With MinIO playing a critical role in storage infrastructure, it's important to collect, monitor and analyze performance and usage metrics.
You might be wondering, “why would I use something like InfluxDB over Prometheus and Grafana?” With Prometheus and Grafana you have multiple components that you need to orchestrate and configure in order to make things work. You must first send the metrics/data to Prometheus and then connect to Grafana to visualize the data. That’s just one example – there are certainly a lot more moving parts to the Grafana ecosystem. With InfluxDB, both the data store and the visualization components are bundled together into the same binary, just like MinIO.
In this blog post we will discuss a couple of things
- A scraper for the InfluxDB service to scrape MinIO metrics
- Configure alerting on the scraped metrics
So let's get started.
MinIO
We’ll bring up a Minio node with 4 disks. MinIO runs anywhere - physical, virtual or containers - and in this overview we will use containers created using Docker.
For the 4 disks, create the directories on the host for minio:
Launch the Docker container with the following specifications for the MinIO node:
The above will launch a MinIO service in Docker with the console port listening on 20091 on the host. It will also mount the local directories we created as volumes in the container and this is where MinIO will store its data. You can access your MinIO service via http://localhost:20091.
If you see 4 Online that means you’ve successfully set up the Minio node with 4 drives.
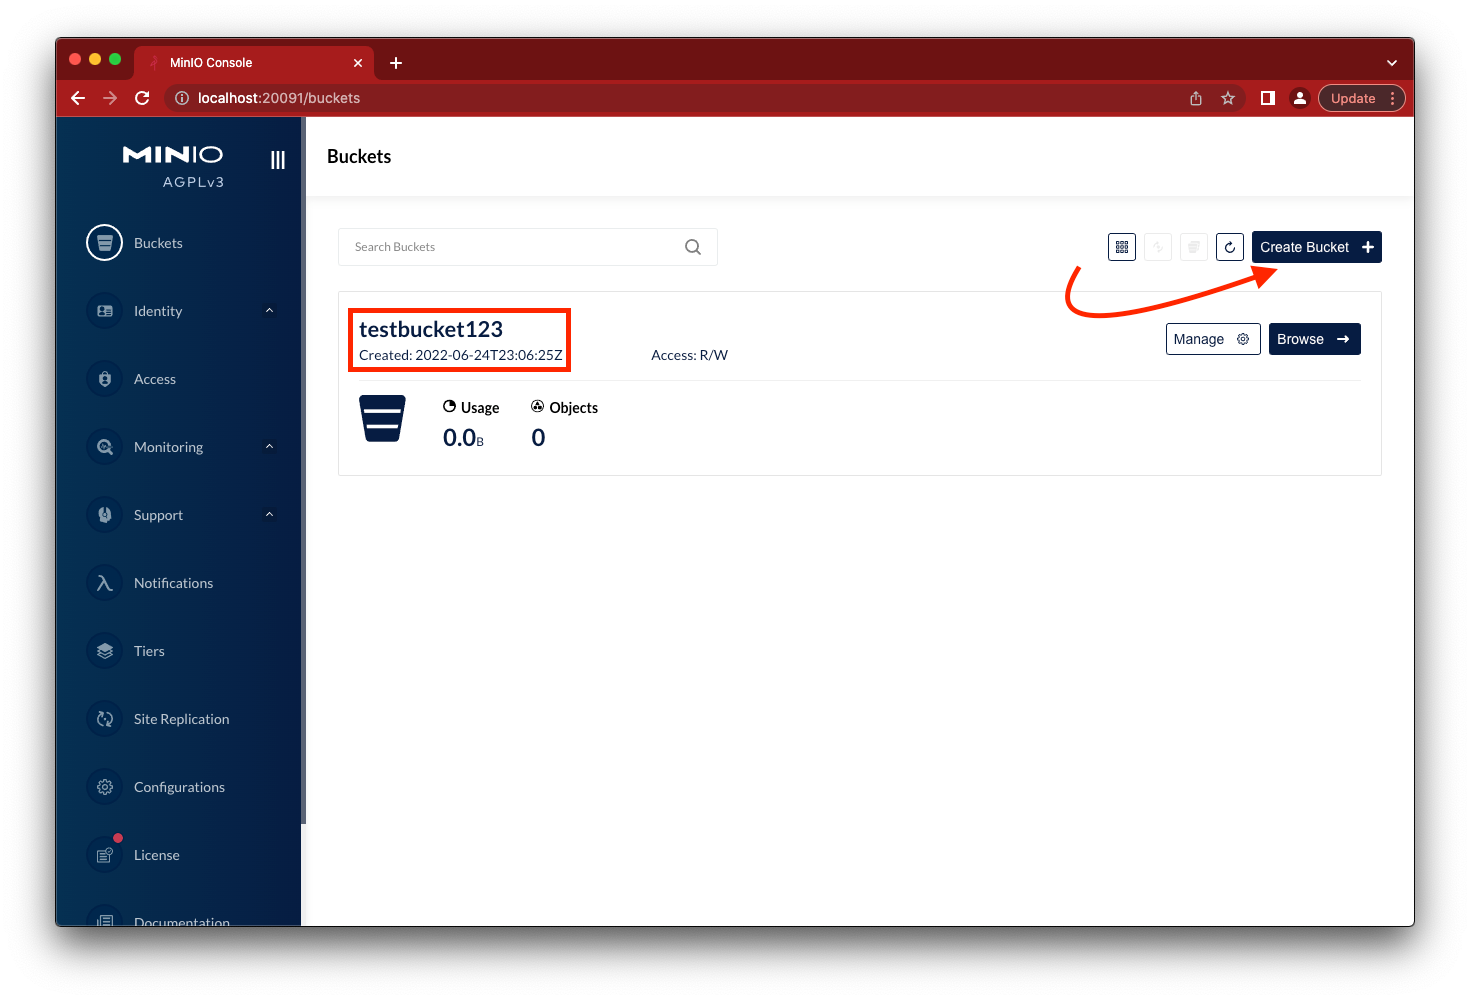
Go to the browser to load the MinIO console using http://localhost:20091, login using minioadmin and minioadmin for username and password respectively. Click on the Create Bucket button and create testbucket123.

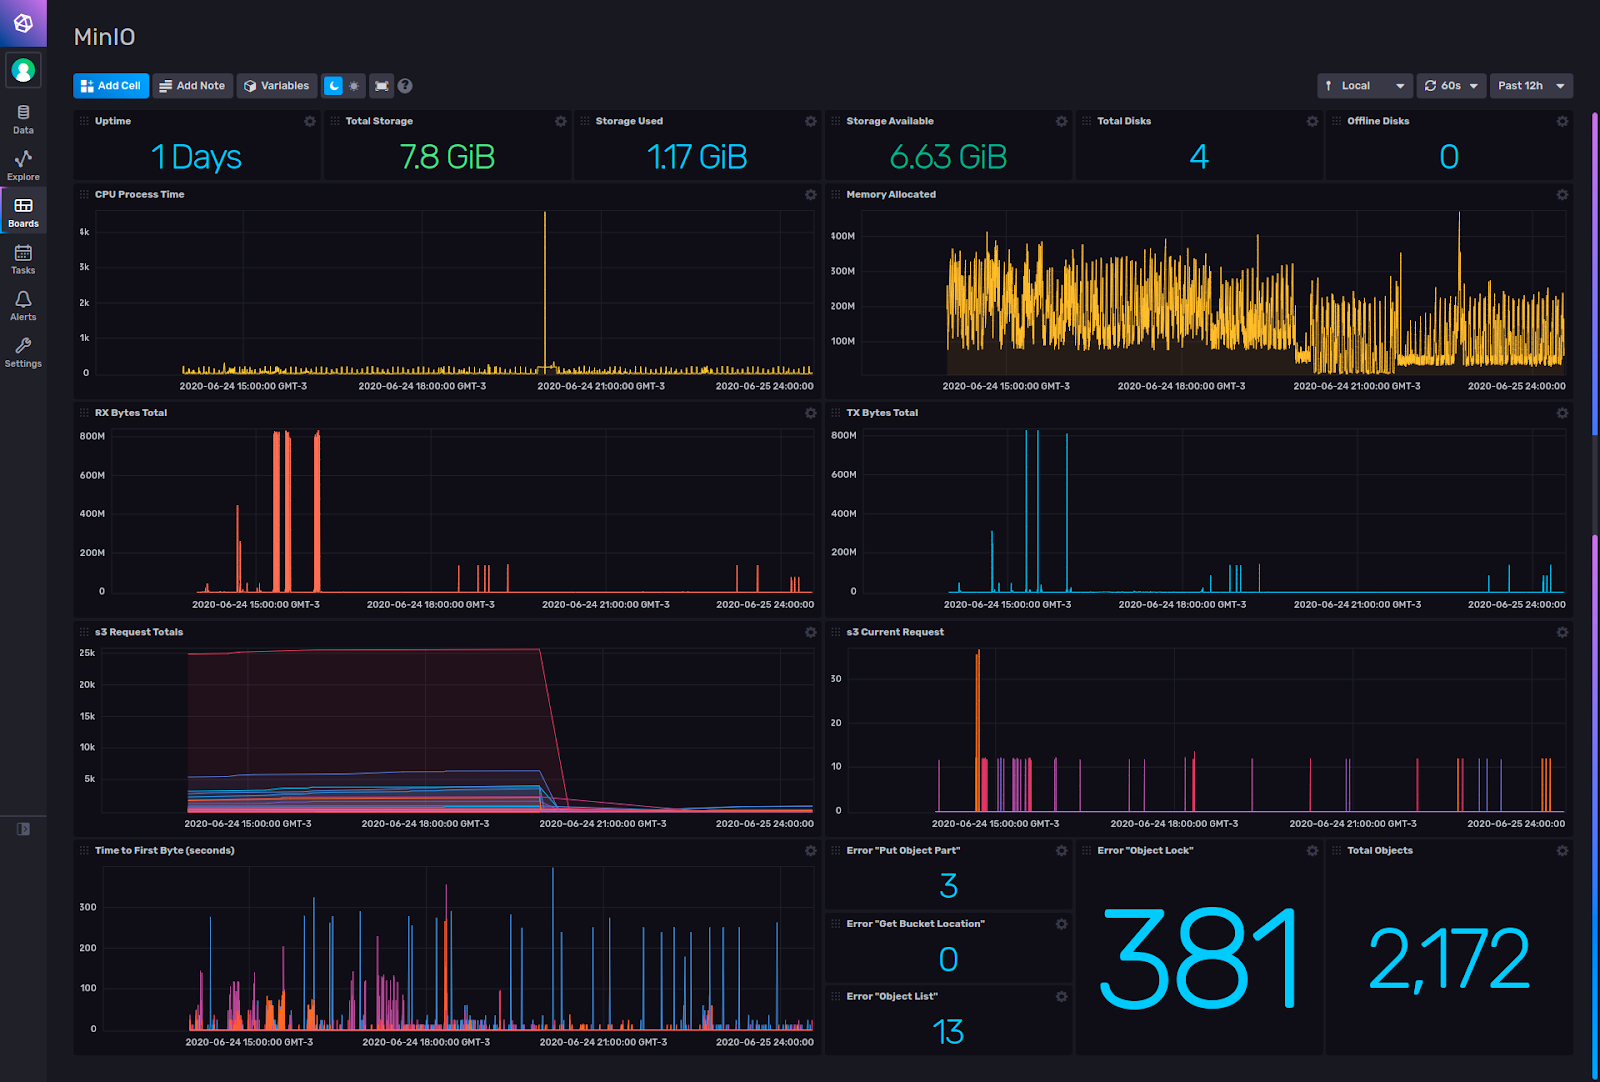
While you’re in the MinIO Console, note that there is a point-in-time metrics dashboard that you can use for quick and easy monitoring.
InfluxDB
Next let’s set up InfluxDB to scrape some metrics from our MinIO container. MinIO publishes quite a few metrics using the Prometheus data model. Please see Metrics and Alerts — MinIO Object Storage for Kubernetes for a complete list of available metrics.
Let's see if we can monitor some basic MinIO stats using InfluxDB.
Create a directory to store InfluxDB data and config.yml
Create the config file required for InfluxDB
Setup default credentials to log into InfluxDB
Note: This bucket above is a database in InfluxDB, not MinIO bucket, they are both called buckets, but are unrelated.
Now you can login to the dashboard using http://localhost:20086
Before we get started:
- Let's create an organization under which we’ll store the MinIO metrics
- Create a InfluxDB Bucket to store the MinIO metrics
Scraper
Scrapers are used to fetch the information from our MinIO service.
Create an InfluxDB scraper
- In the navigation menu on the left, select Data (Load Data) > Scrapers.

- Click on Load Data
- Click Create Scraper.
- Enter “MinIO” as the name for the scraper.
- Select the Influx Bucket created earlier to store the scraped data.
- For the Target URL to scrape, enter the URL of the MinIO instance running in Docker. Since both containers can talk to each other internally The URL value is
http://minio:9000/minio/v2/metrics/cluster, which provides InfluxDB-specific metrics in the Prometheus data format. - Click Create.
At this point, you should be collecting metrics and, optionally you could use something like Grafana to visualize them. We’ll go into more detail on this topic in the next blog post.

Alerting
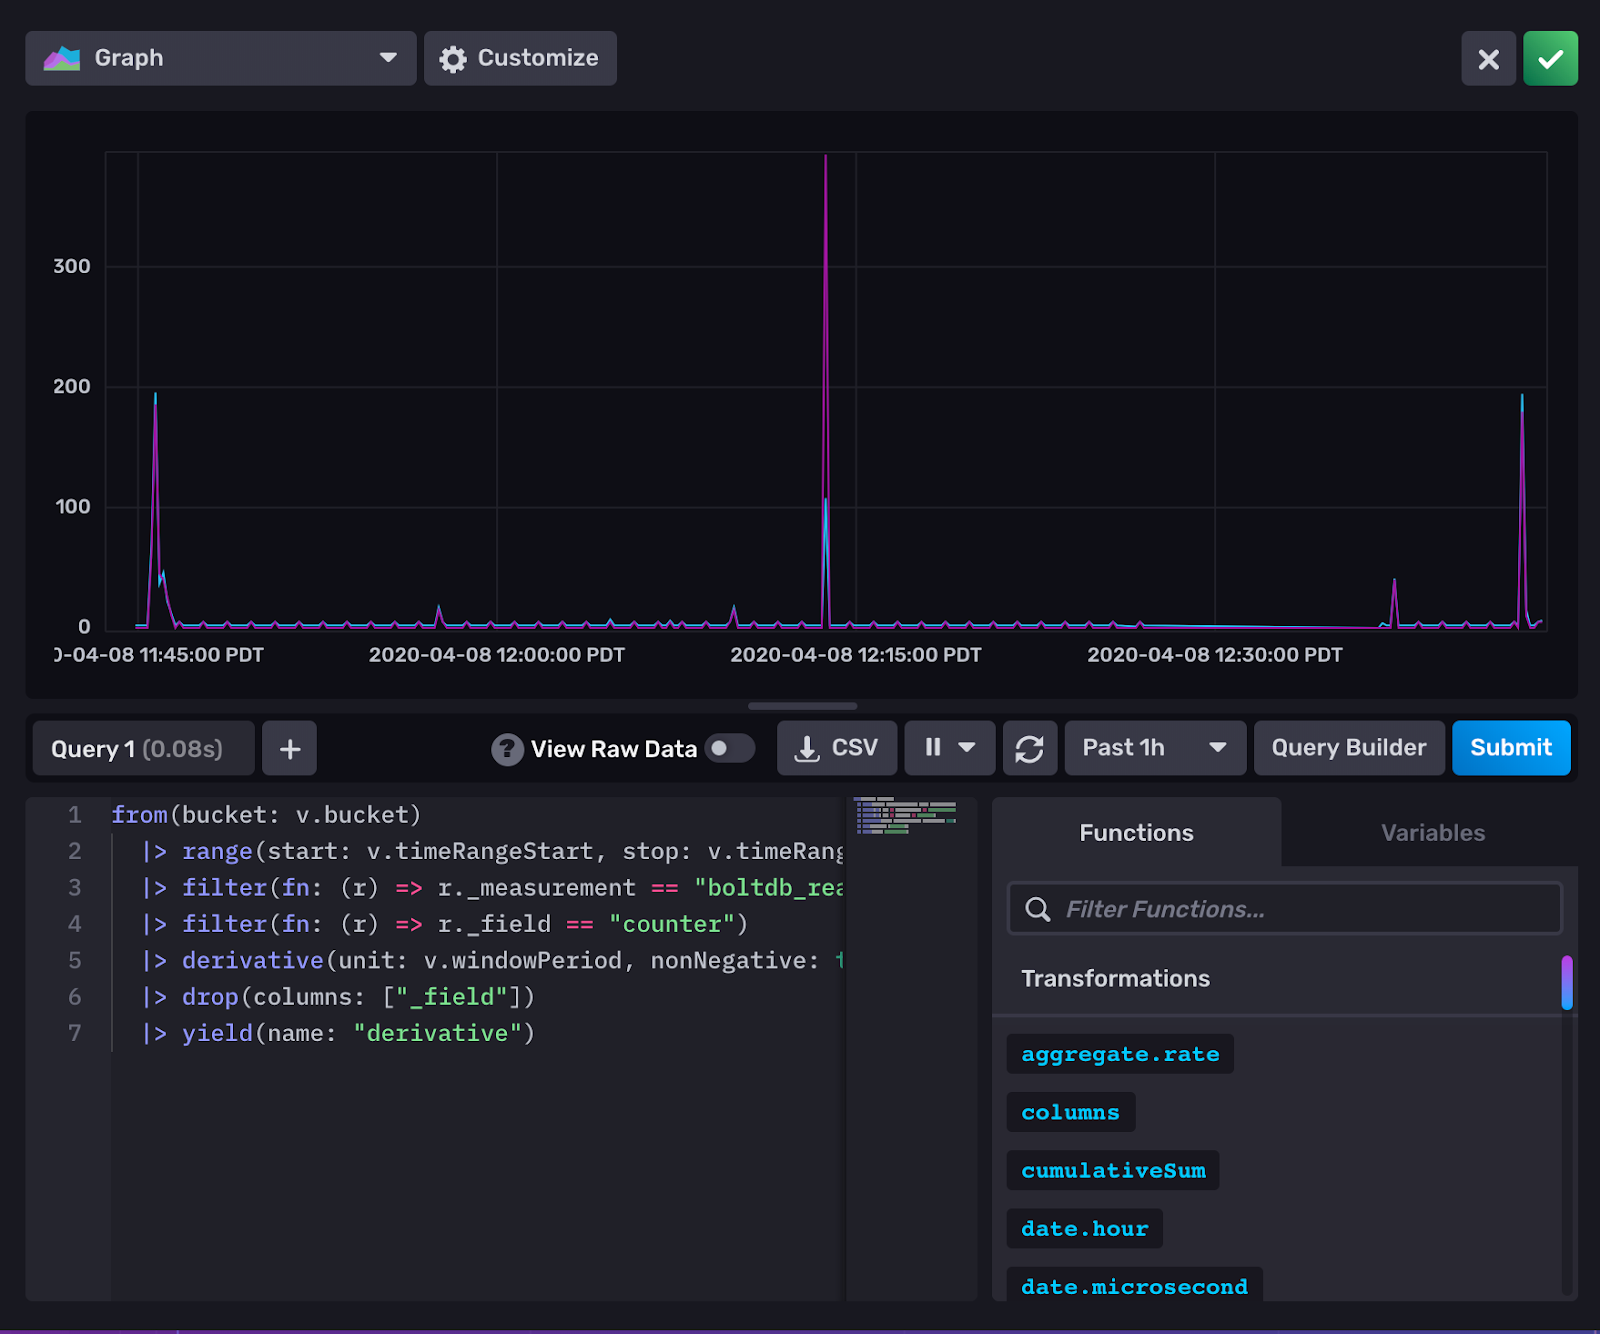
It’s pretty easy to set up alerts based on the thresholds that are set for the captured metrics. First, let's ensure the scraper is working properly using the data explorer.

Set a filter on minio_cluster_capacity_usable_total_bytes and minio_cluster_capacity_usable_free_bytes to compare the total usable against total free space on the MinIO deployment.
Create a new check using the following steps:
- In the navigation menu on the left, select Alerts > Alerts.
- Click CREATE and select the type of check to create.
- Click Name this check in the top left corner and provide a unique name for the check, and then configure the check.
So what would you actually set these checks to alert on?
- Create a threshold check named
MINIO_NODE_DOWN. Set the filter for theminio_cluster_nodes_offline_totalkey. Set the thresholds to warn when the value is greater than 1. - Create a threshold check named
MINIO_QUORUM_WARNING. Set the filter for theminio_cluster_disk_offline_totalkey. Set the thresholds to critical when the value is one less than your configured Erasure Code parity setting. For example, a deployment using EC:4 should set this value to 3. - One of the most popular checks set by our customers is the amount of free disk space available
minio_node_disk_free_bytes. This is critical because you never want to reach close to 100% of any disk capacity because the closer a disk gets to full, the fewer operations you can do on them. So generally it is recommended to set the thresholds around 20% of the total disk space available. For example, if your disk is 4 TB, you would want to set the threshold at 0.8 TB.
For more thresholds check out the docs. Once you have the thresholds selected you can have them notified to you via Slack or Pagerduty.
Final Words
With any infrastructure, especially critical infrastructure as storage, it’s paramount the systems are monitored with reasonable thresholds and alerted on as soon as possible. It is not only important to monitor and alert but also do trending for long term analysis on the data. For example, let's say you suddenly notice your MinIO cluster using up tremendous amounts of space, would it be good to know whether this amount of space was taken up in the past 6 hrs or 6 weeks or 6 months? Based on this you can decide whether you need to add more space or prune existing inefficiently used space.
Are you an InfluxDB fan? In our next InfluxDB blog post, we’ll show how to use MinIO as a backend store for InfluxDB using their latest IOX code base and show you how to create custom dashboards to monitor MinIO.
If you have questions about setting up new checks or have existing dashboards that you built for MinIO, and would like to share with us, please reach out to us on Slack!


