Visualize usage patterns in MinIO using Elasticsearch and Beats

MinIO is frequently used to store Elasticsearch snapshots, it makes a safe home for Elasticsearch backups. It is more efficient when used with storage tiering, which decreases total cost of ownership for Elasticsearch, plus you get the added benefits of writing data to MinIO that is immutable, versioned and protected by erasure coding. In addition, saving Elasticsearch snapshots to MinIO object storage makes them available to other cloud native machine learning and analytics applications. In a previous blog we went over details on how to snapshot and restore from Elasticsearch.
Since then, both MinIO and Elasticsearch have grown in their feature set and now we can do more:
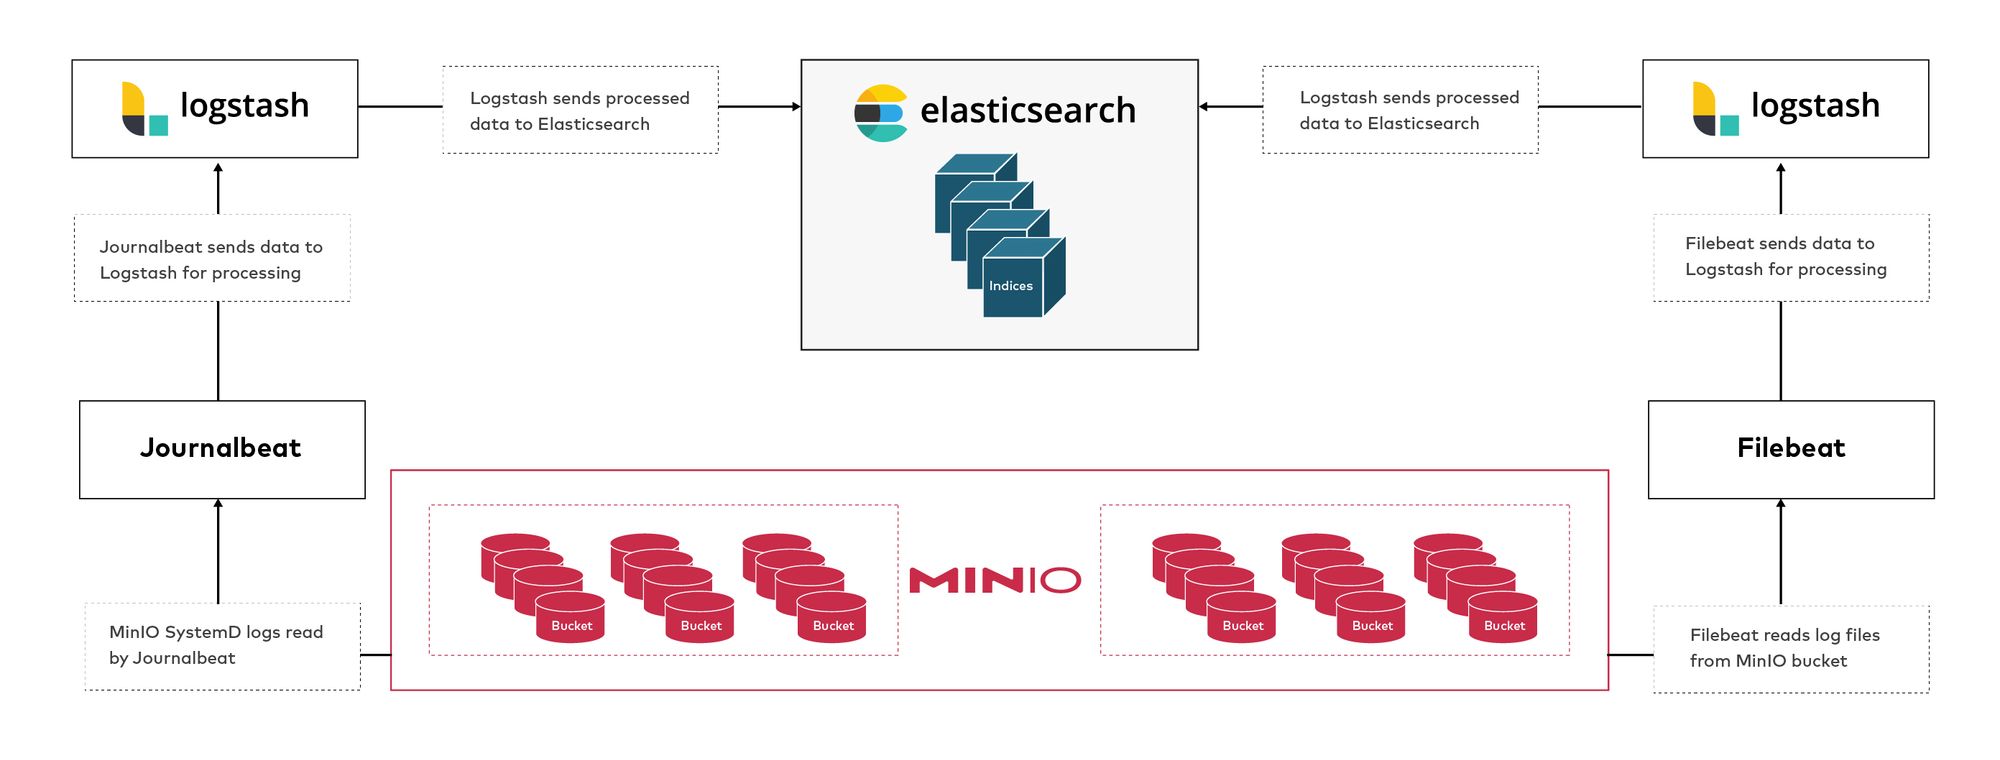
- We’ll send MinIO journalctl logs to Elasticsearch.
- Send logs from MinIO bucket to Elasticsearch.
MinIO is the perfect companion for Elasticsearch because of its industry-leading performance and scalability. MinIO’s combination of scalability and high-performance puts every data-intensive workload, not just Elasticsearch, within reach. MinIO has created a comprehensive blueprint for data infrastructure to support exascale AI and other large scale data lake workloads. It is called the MinIO DataPod. Why? Because exascale data is the reality that is common today in today's enterprise. By sending MinIO service logs to Elasticsearch, we will gain visibility into the operations of MinIO, you can see patterns and alerts in a Kibana graphical interface that would allow you to run further analysis and even alerting based on certain thresholds. For example, you might want to check for trends or bottlenecks and try to identify patterns in workload type or time of day. In this blog post we’ll show you how to visualize these patterns in a consumable way that facilitates insight.

Installing ELK Stack
We’ll go through the most basic way to install Elasticsearch-Logstash-Kibana. We’ll install it on the same node for the sake of simplicity and to ensure we don’t have to worry about opening ports between the nodes.
In production, you should architect these on separate nodes so you can scale the individual components.
- Add the apt repo key where not only Elasticsearch but other components such as Logstash and Kibana are also downloaded later in the next steps.
- Install the Elasticsearch package.
- Start and verify Elasticsearch is working. After starting, even if the status is running, it might take a minute or two for Elasticsearch’s API to respond, so if it timeouts as soon as you start the service, try again after a few minutes.
We’ll use Kibana to visualize our logs. We can use ElasticSearch API as well to read the indices but the graphical interface will make it more user friendly to understand.
- Install and start Kibana.
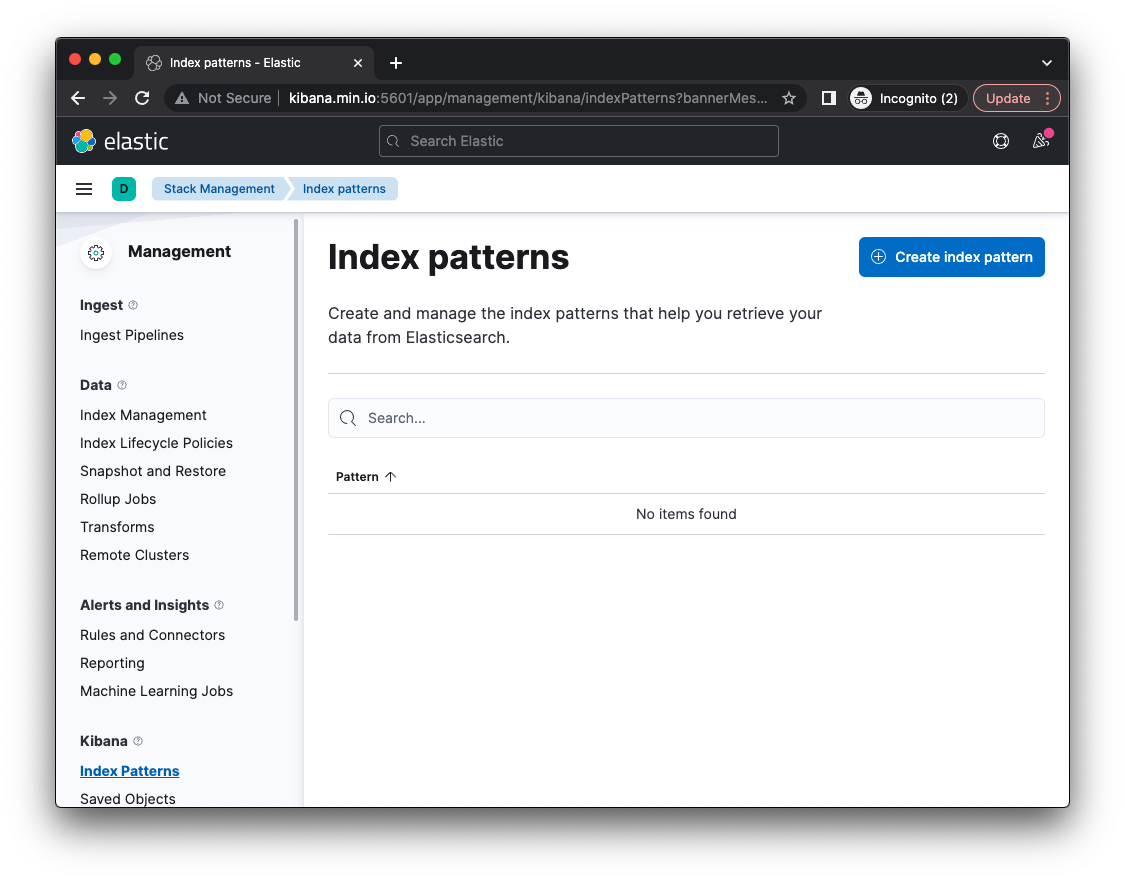
- Go to
http://localhost:5601I have pointedkibana.min.iotolocalhostin/etc/hostsin these examples for better visibility but you can uselocalhost.

There are no indices at this time, but we’ll add them in the next few steps. In order to process logs to load our indices, we need to install Logstash.
Think of Logstash as the log parser. It doesn’t store anything, it has inputs and outputs, and in between, a bunch of different types of filters. It groks the input data, filters/transforms it, then outputs it variously.
- Install Logstash
- Configure Logstash to output to Elasticsearch in the following file
Using the contents below to send to a default index.
- NOTE: Before starting Logstash, run it in debug mode to ensure everything is working as expected. In my case it wasn’t able to find pipelines.yml so I had to manually fix that by symlinking it to the original location. So please verify before proceeding.
- If everything looks good, Enable and Start Logstash service
Logstash is technically running at this point but we haven’t configured any input to consume data, only the output, so let’s do that now by installing MinIO and collecting the service logs.
Installing MinIO
In a previous blog we discussed how to configure MinIO as a SystemD service. We’ll use the same principles here except instead of a binary it will be installed as an OS package.
- Install the MinIO .deb package. If you are using another OS family you can find other packages here
- Create a user and group
minio-userandminio-user, respectively
- Create the data directory for MinIO and set the permissions with the user and group created in the previous step
- Enable and Start MinIO service
- You can verify MinIO is running either through the console by going to
http://localhost:9001or through mc admin
If you see messages similar to these, you can be assured that MinIO has started. Later we’ll create a bucket and add some objects to further test MinIO.
Send Journalctl Logs using Journalbeat
Elasticsearch uses Beats to collect data from various sources and there are different types of beats. Journalbeat is one such Beat; from the name you can tell it reads journalctl logs. We’ll read MinIO’s journalctl logs in this example.
- Install the Journalbeat package. There are different packages for the most common OSs, but here we’ll install the .DEB package on this Ubuntu-based machine.
- Update
01-example.confwith the following configuration. This allows Logstash to listen on port 5044 for various Beats, in this case Journalbeat.
- Restart Logstash for the setting to take effect.
- Modify
journalbeat.ymlto addminio.serviceexplicitly. You can configure various inputs to be more broad and collect all journalctl logs from all services.
- In the same
journalbeat.ymlfile, modify the output to send to our Logstash Beats port5044we configured earlier in 01-example.conf. - Comment out
output.elasticsearchbecause we want the logs to be parsed through Logstash.
- Enable and Start journalbeat
- Use the
/_cat/endpoint to see the new indices. You should see something like below
- There should already be some logs. If you don’t see the logs you can do one of two things:
- Modify the date in the Kibana dashboard to widen the range of logs to show. It could be possible that between the time we started MinIO and installed Journalbeat the logs might have gotten older than the default range in Kibana, which is usually 15 mins. So if you widen the range you should see the old logs.
- If you need some fresh journalctl logs immediately, just restart MinIO like below
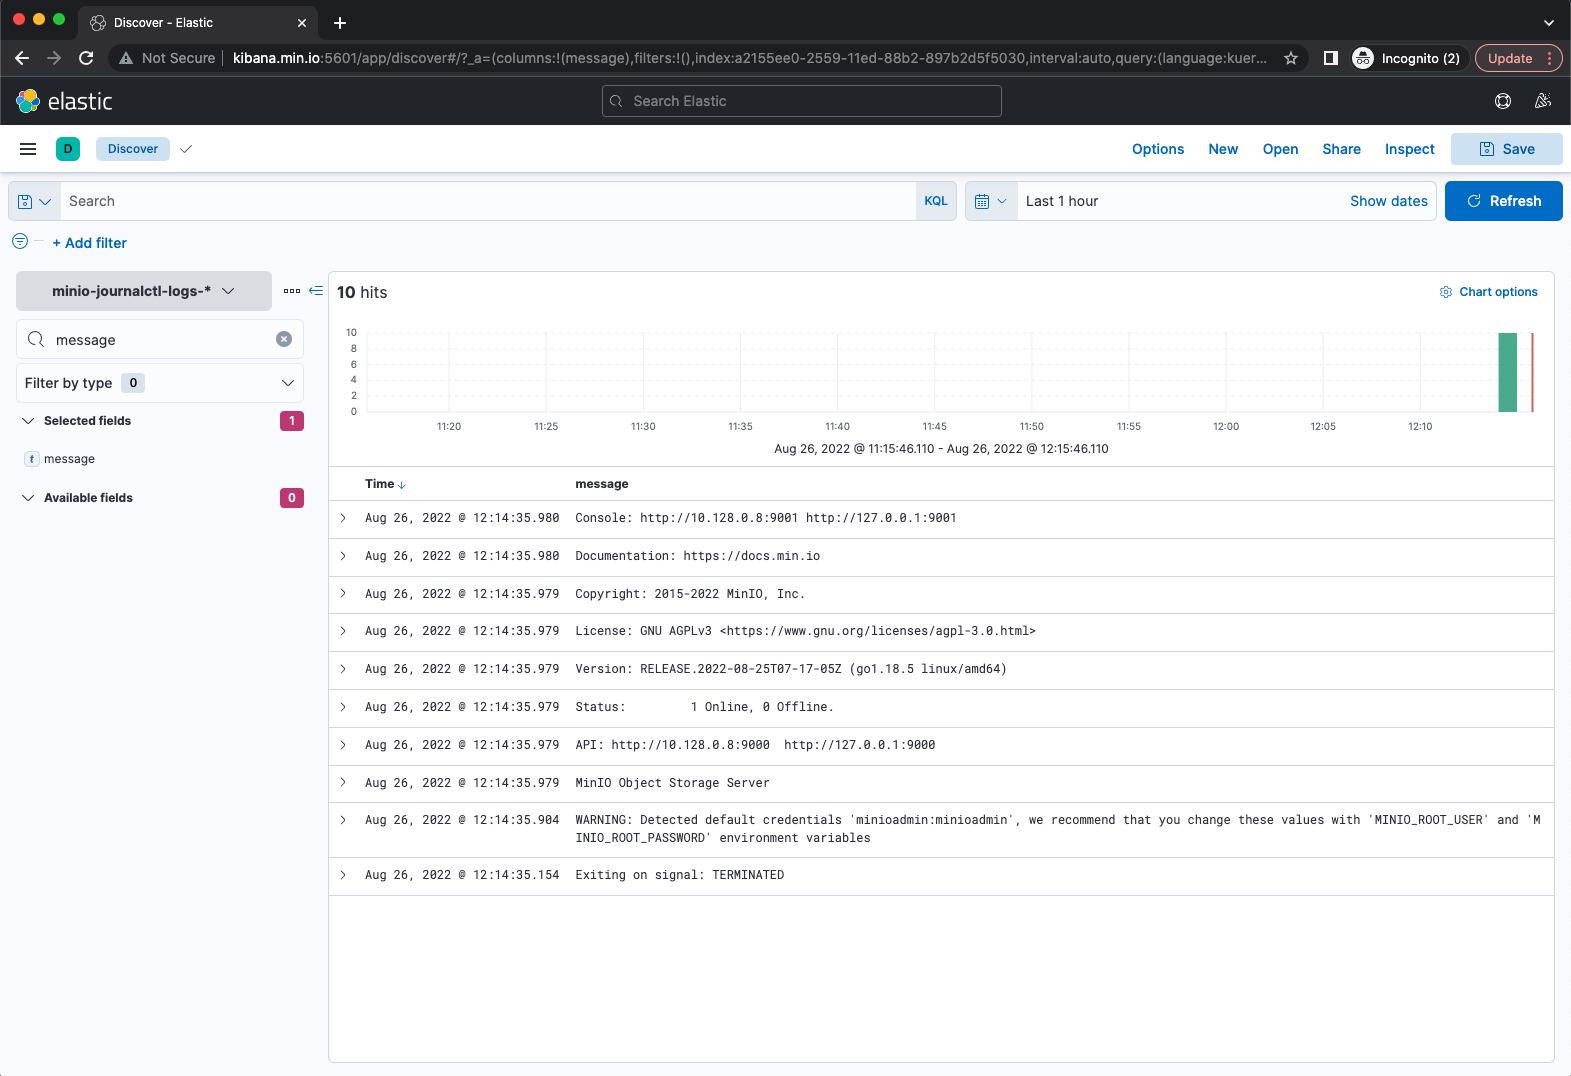
- If you go to the Kibana dashboard you should almost immediately see new logs in the index
minio-journalctl-logs-*

If you see something similar to the above, the MinIO journalctl logs are in Elasticsearch now.
Read Apache Logs from MinIO using Filebeat
Let's say you already have logs in a MinIO bucket and you want to load them into Elasticsearch. One possible use case for this is archival logs. Sometimes you only want to restore a specific range of logs for analysis, and once you are done analyzing them, you would delete those indices from the cluster. This saves cost by avoiding storing old logs that are not be used on a daily basis.
We’ll use Filebeat’s S3 input to read from a MinIO bucket.
- Create a bucket in MinIO to store Apache server logs.
- Copy the Apache logs to the bucket
- Download and Install Filebeat
- Configure Filebeat with the following in
filebeat.yml: - Input from an S3 source, in this case the MinIO
apachelogsbucket. - Output to our Logstash processor
- Before we start Filebeat and send logs to Elasticsearch through Logstash, let's update our trusty
01-example.confLogstash configuration to send these to a new index.
- Restart Logstash for the changes to take effect.
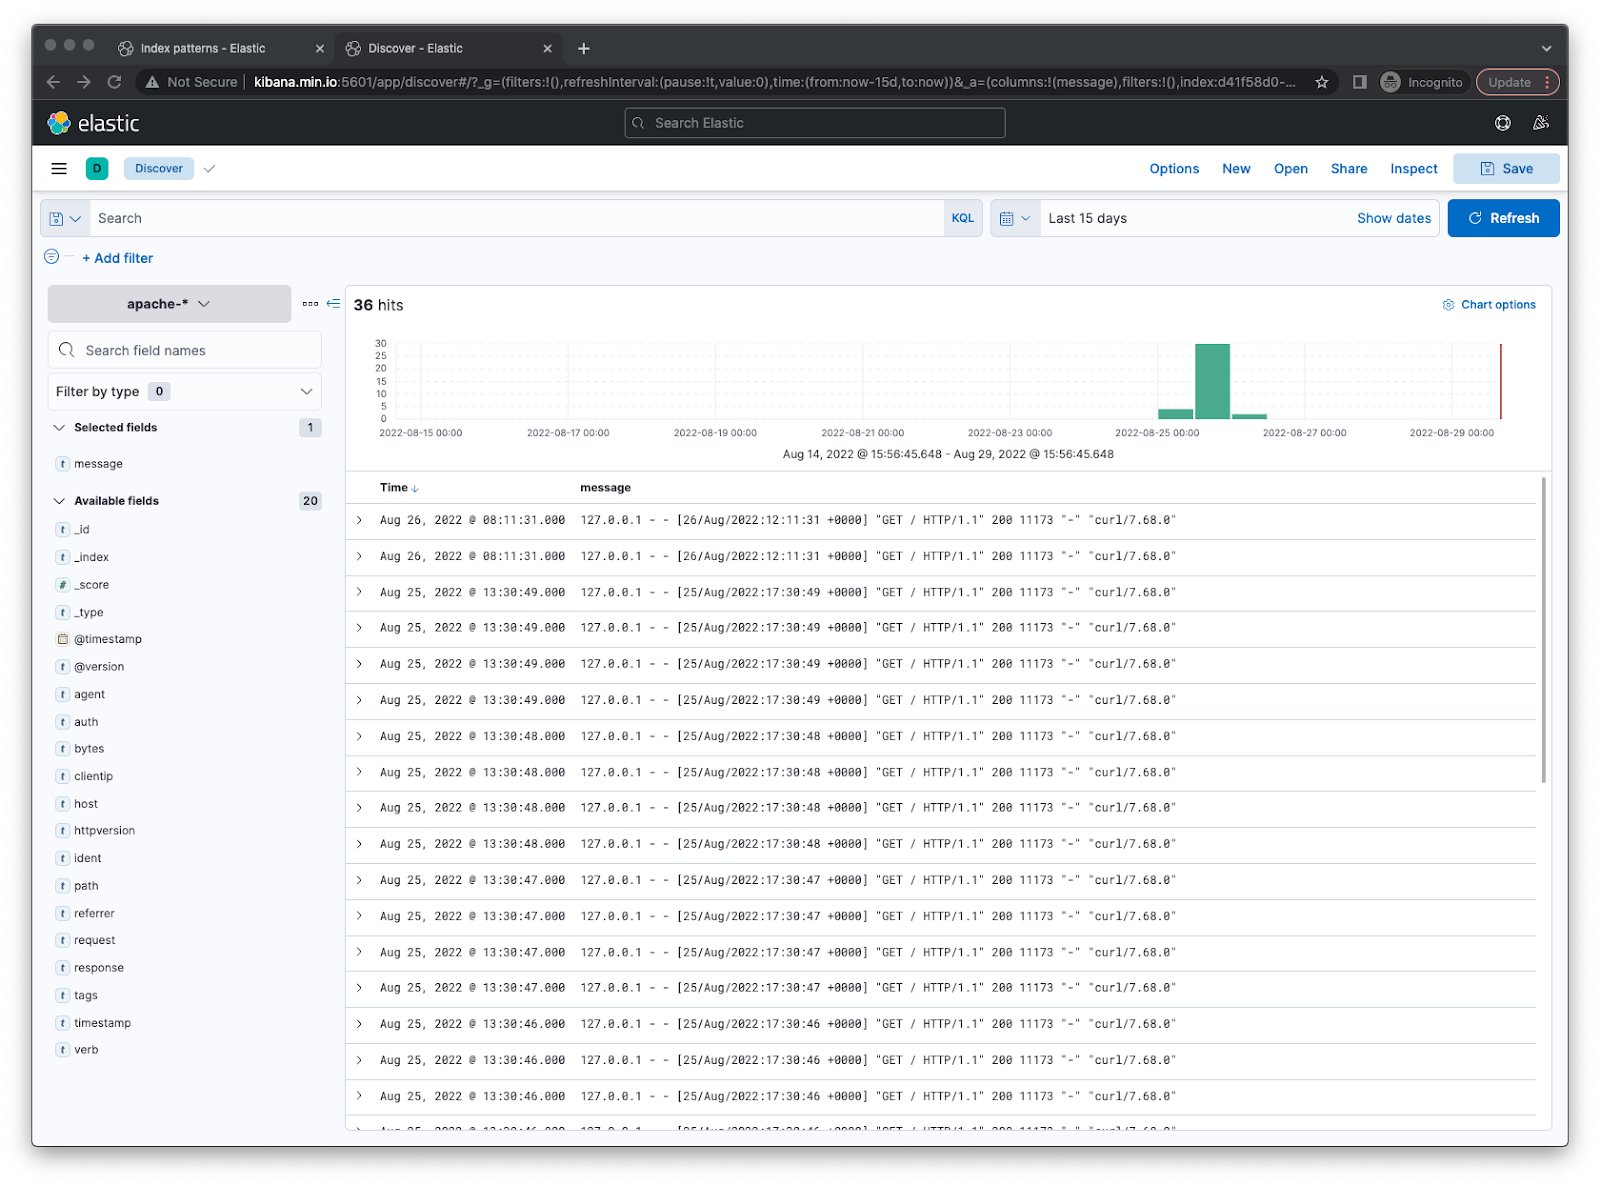
- If you check Kibana now under
apache-*you should see some Apache logs.

Final Thoughts
Previously, we showed you how Elasticsearch indices can be snapshotted, backed up, and restored using MinIO.
In this installment we showed you how to:
- Send MinIO Journalctl logs to Elasticsearch
- Send Apache logs from a MinIO bucket
You could take this one step further and integrate Filebeat with Kafka notifications. This allows you to leverage MinIO’s bucket notification feature to kick off Filebeat to read the bucket when a new object is added rather than polling it every few seconds.
Now you have better insight into the operations MinIO performs in a pretty Kibana dashboard. Not only that, but instead of storing massive amounts of data in an Elasticsearch cluster, which can get quite expensive, we also showed you how you can load logs from a MinIO bucket ad hoc to an index of your choice. This way once you are done analyzing them you can discard the index. MinIO fits seamlessly into existing DevOps practices and toolchains, making it possible to integrate with a variety of Elasticsearch workflows.
Got questions? Want to get started? Reach out to us on Slack.


