Tame the AI beast with Monitoring and Alerting

AI is a beast. It constantly needs to be fed. What does it need to be fed? Data of course, and lots of it. Remember, data and AI are two sides of the same coin. People often forget the reason AI models could be built in the first place is because they are fed several hundreds of petabytes to exabytes of data, stored on AIStor of course, several thousand times for such models to be effective.
But when managing data at such an immense scale, it is impossible to look at individual logs or nodes to try to make sense of it. What you need is a holistic view of the state of your data and the overall cluster infrastructure. And one of the most common pieces of infrastructure that often needs to be monitored and replaced if needed are hard drives (SSD, NVMe, etc.). Hard drives fail due to a variety of reasons and MinIO is perfectly capable of running at full speed even with more than a couple of simultaneous drive failures, depending on the Erasure Code calculations, without breaking a sweat.
But when enough drives fail, physics takes over. If those failed drives are not replaced promptly or get to a point where more drives than what the erasure code is configured to. This could have a cascading effect, for example your ETL job that reads requests from a Kafka queue might run slow or get hung up altogether because it's unable to read from the MinIO bucket because too many drives have been out of commission for too long.
It's improbable to manually do any of the above, so in this post we’ll show you how you visualize the cluster metrics in a web browser and also we’ll set up alerting so that when something like a drive needs to be replaced or drive runs out of space we can get alerted for it.
Let’s get started.
Pre-requisites
We would like to keep this post succinct and to the point so below are some of the prerequisites that we would expect you already have set up before proceeding to the next steps.
- Have AIStor deployment up and running.
- Grafana running in Docker (for visualizing)
- Prometheus running in docker (for storing metrics and alerting)
Collecting Metrics Data
We’ll configure the Prometheus service to scrape and display metrics data from our MinIO deployment. In addition to that we’ll also set up an Alert Rule on a MinIO Metric to trigger an AlertManager action.
Add the following scrape config to your Prometheus container.
- Set an appropriate scrape_interval value to ensure each scraping operation completes before the next one begins. The recommended value is 60 seconds. Some deployments require a longer scrape interval due to the number of metrics being scraped. To reduce the load on your MinIO and Prometheus servers, choose the longest interval that meets your monitoring requirements.
- Set the job_name to a value associated with the MinIO deployment. Use a unique value to ensure isolation of the deployment metrics from any others collected by that Prometheus service.
- MinIO deployments started with MINIO_PROMETHEUS_AUTH_TYPE set to "public" can omit the bearer_token field.
- Set the scheme to http for MinIO deployments not using TLS.
- Set the targets array with a hostname that resolves to the MinIO deployment.This can be any single node, or a load balancer/proxy which handles connections to the MinIO nodes.
At MinIO we recommend you monitor and alert on the following metrics.
The following query examples return metrics collected by Prometheus every five minutes for a scrape job named minio-job:
In order to be alerted lets create a couple Alert Rules
The above configuration will alert you on two of the arguably most important things you want to monitor on the MinIO cluster. Nodes and Disks. If either of these get below the minimum count required according to Erasure Code settings then you might start to see some data accessibility issues. Again, physics takes over after a certain point.
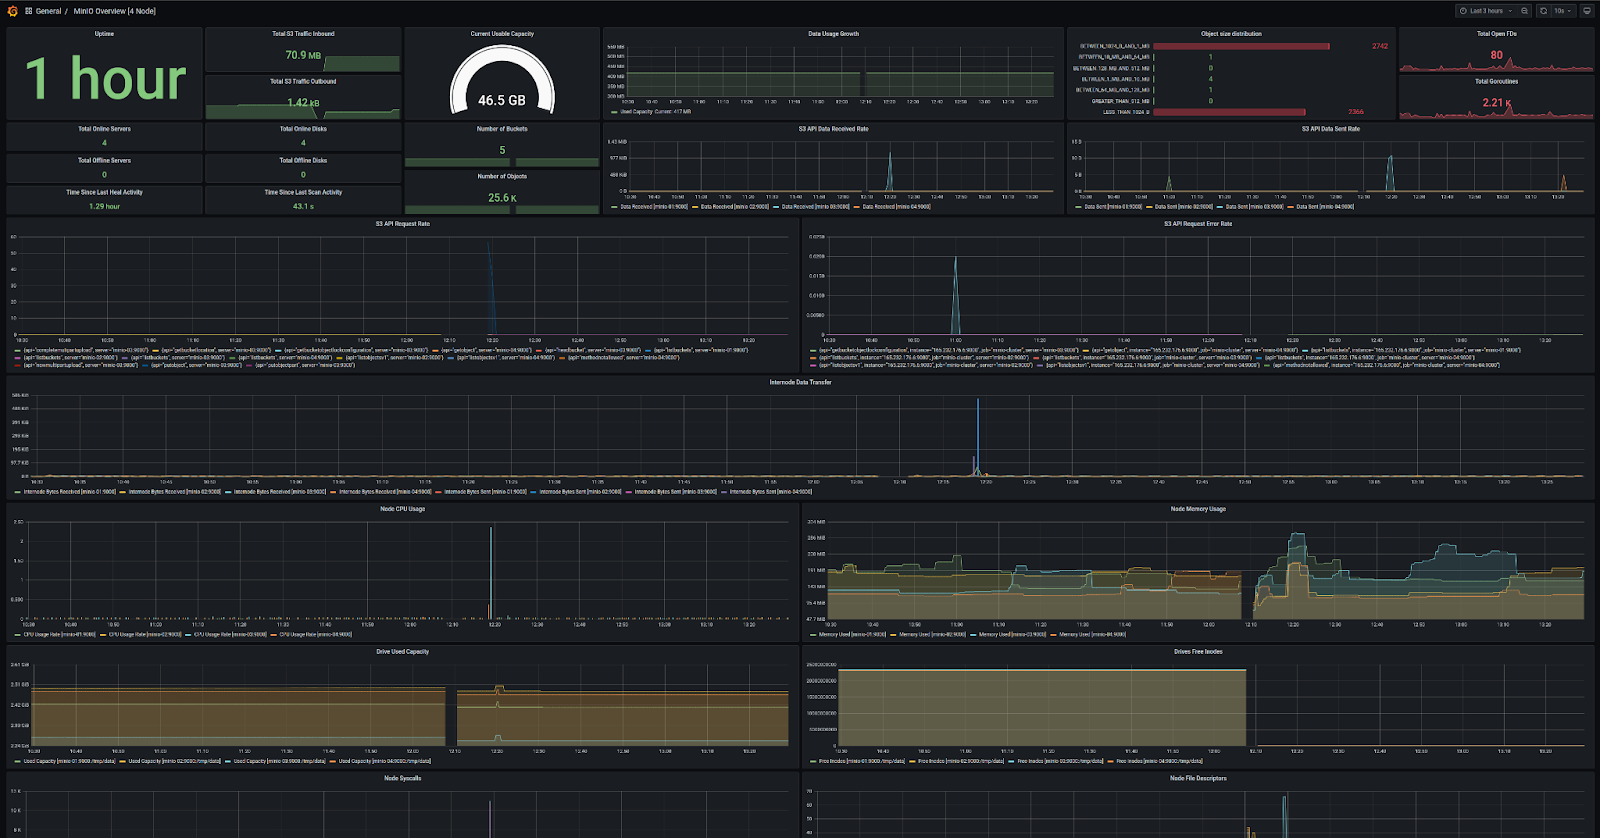
Visualizing Metrics
To visualize the metrics, first download the configuration of the Dashboard template link that was curated by MinIO core engineers.
For MinIO Deployments running with Server-Side Encryption (SSE-KMS or SSE-S3), the dashboard includes metrics for the KMS. These metrics include status, request error rates, and request success rates.
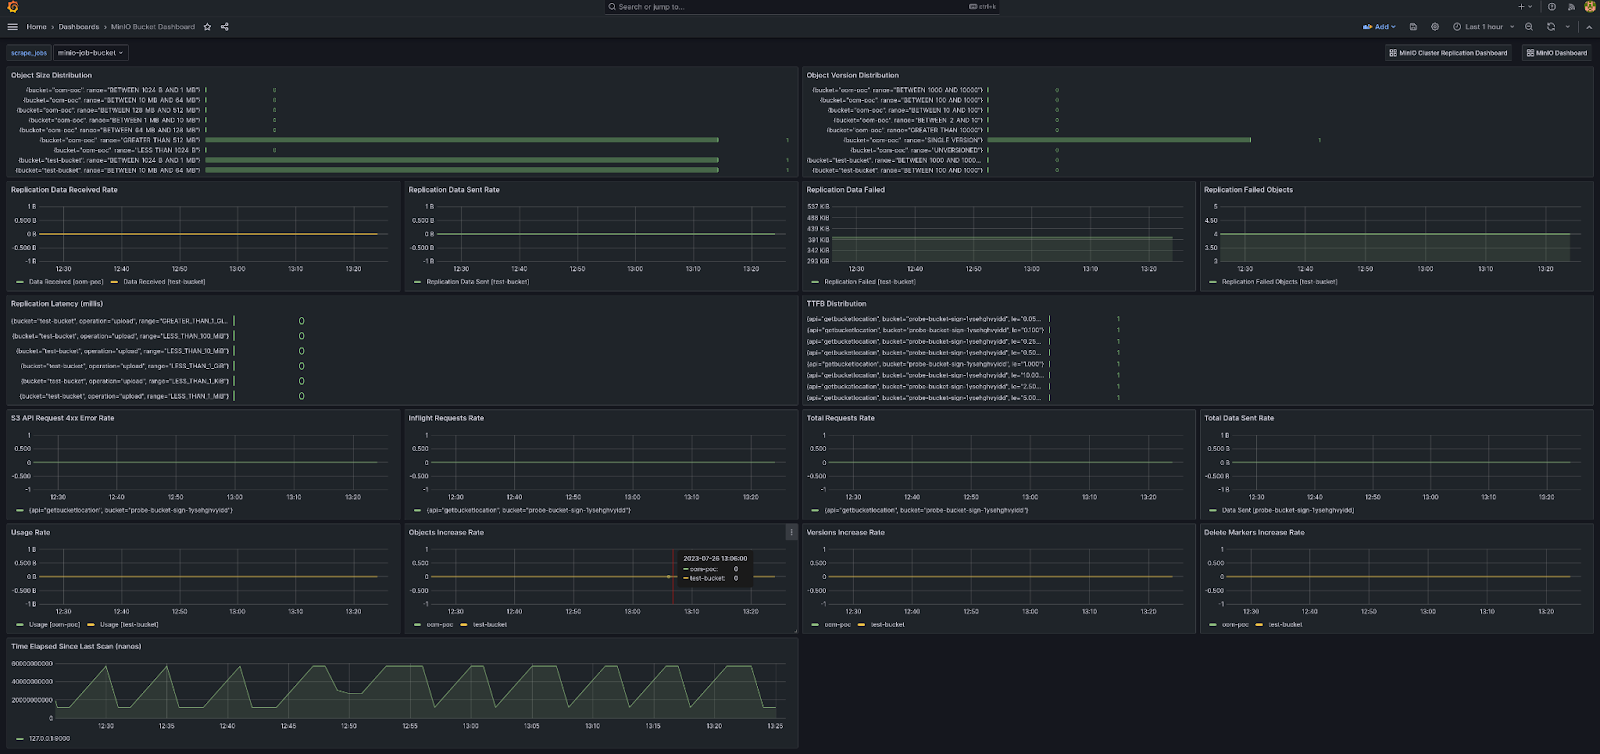
Here is how the bucket metrics would look like.
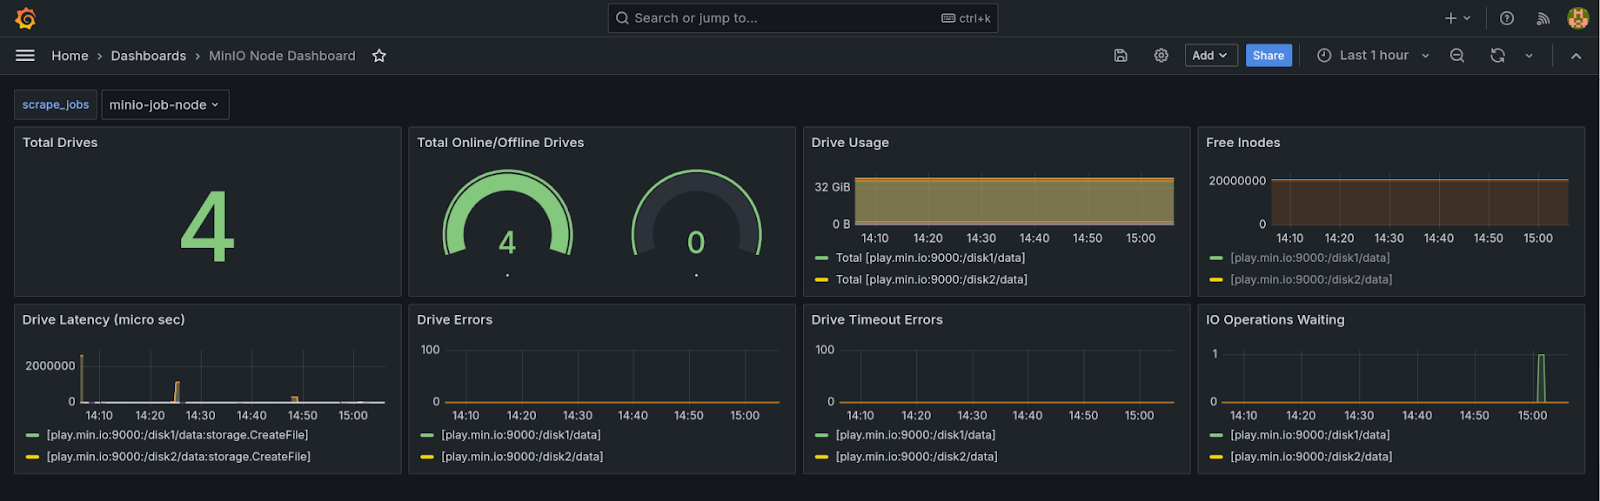
Node Metrics give you more detailed information on a per-node basis.
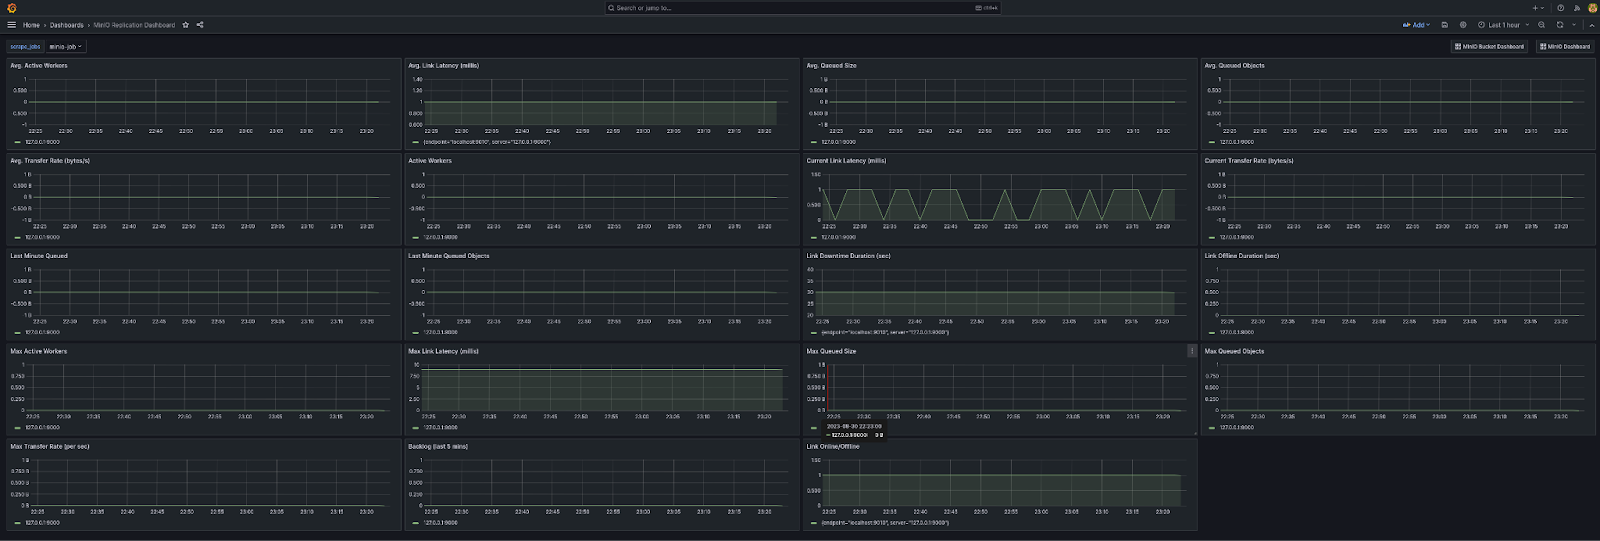
Last but not least the Replication dashboard
Visualizing your data for patterns over the course of several months is just as important as monitoring any other part of your infrastructure.
Being on top of your AI Data Infrastructure
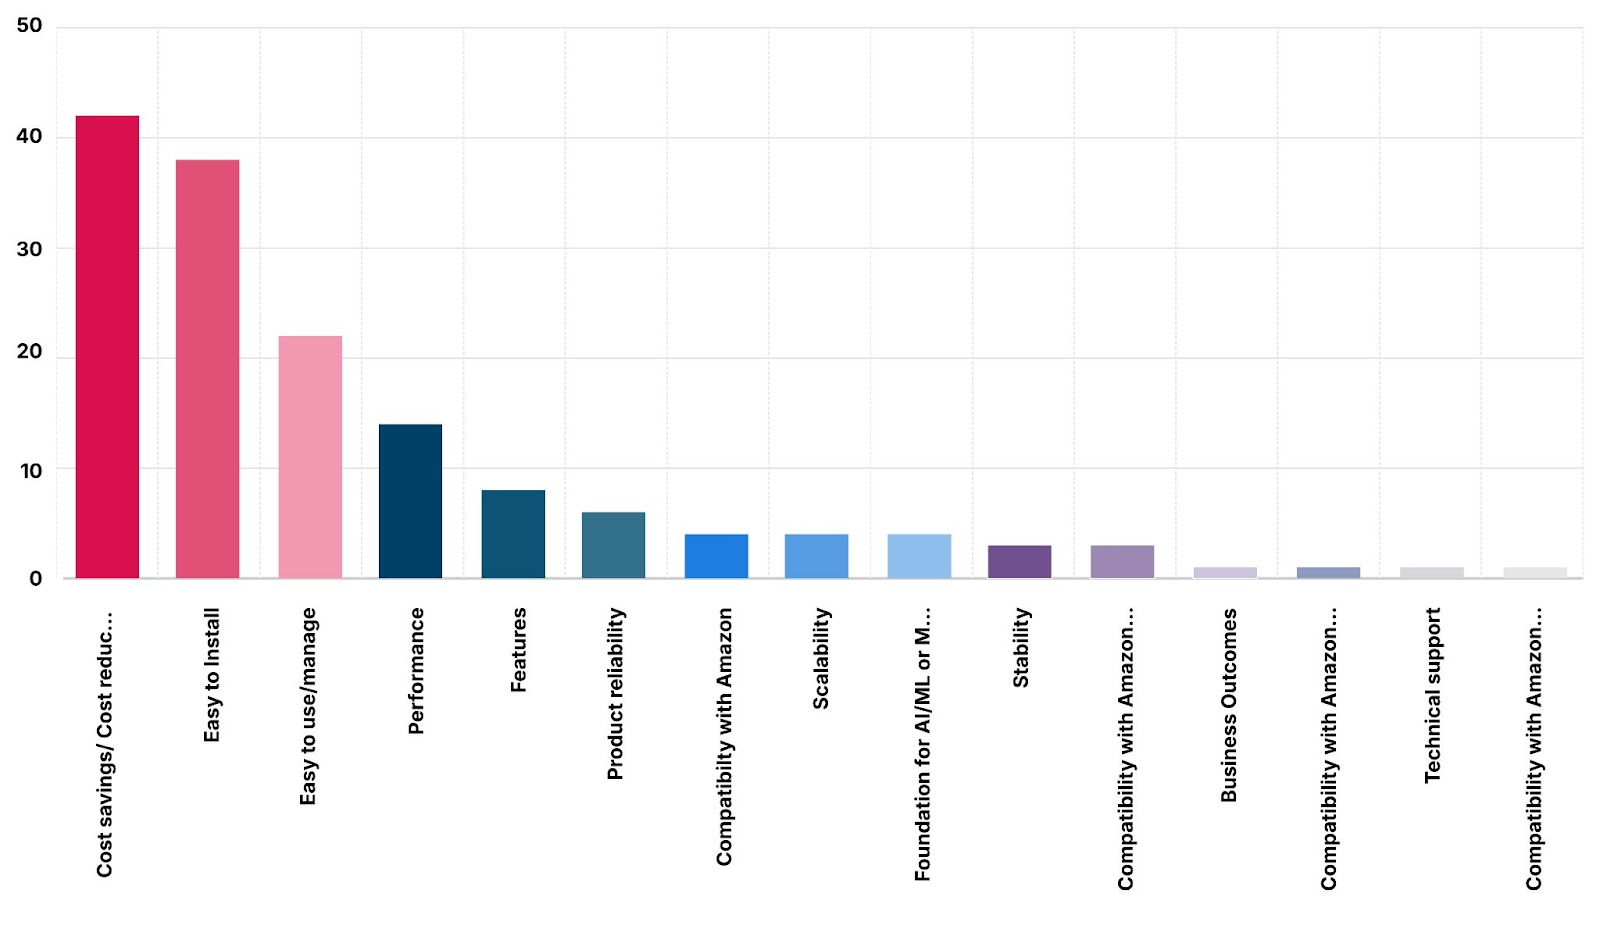
AIStor is probably one of the simplest and lightweight object store solutions out there. In fact time and time again folks have rated MinIO for Ease of Install and use as one of the top three factors for considering MinIO.
While MinIO will let you shoot yourself in the foot, to a reasonable extent (unlike Ceph), you can only go so far without properly maintaining and monitoring your infrastructure. As long as the infrastructure is being monitored and alerted on possible concerns you can stay on top of your AI data storage infrastructure ensuring it's available to everyone at lightning fast speed at all times.
At MinIO we are not only about simplicity but about best practices when it comes to managing your infrastructure so you don’t have those 3 AM pager calls. If you have any questions on AIStor or any AI/ML or Big Data topics in general be sure to reach out to us on Slack!