Distributed Tracing with MinIO using OpenTelemetry and Jaeger

Several years ago when you had a monolithic application, it was fairly easy to debug and diagnose since there was probably only one service with a couple of users. Nowadays systems are broken up into smaller microservices deployed in containers on top of Kubernetes in multiple clusters across different cloud environments. In these kinds of distributed environments, there is a need to observe it all, both the overall picture, and, if need be, at a more granular level.
Observability can be roughly divided into three sub-categories: logging, metrics, and tracing. In this blog post we’ll show you how simple it is to get set up with tracing in your new or existing MinIO application. We’ll build a small MinIO app that does a few basic requests; this will be our base application to which we’ll add tracing to gain a better picture of how system components and functions interact.
Tracing is the term used to describe the activity of recording and observing requests made by an application, and how those requests propagate through a system. When systems are set up in a distributed fashion, we call this distributed tracing as it involves observing the application and its interactions through multiple systems. For example, as a developer your code probably includes multiple functions, but you are more interested in how long the MinIO functions take to execute and the interdependency of those functions as they are used in the application. Tracing will give the necessary insights by:
- Identifying performance and latency bottlenecks
- Finding root cause analysis after major incidents
- Determining dependencies in multi-service architecture
- Monitoring transactions within your application
MinIO
We’ll get started with a small MinIO Python application that will show a couple of simple operations. We’ll then later add the code for tracing to measure the time it takes for our code to execute.
Installing MinIO
There are several ways to install MinIO in various environments. In this blog post we’ll launch MinIO with Docker, but in production please be sure to install in a distributed setup.
- Create a directory on your local machine where MinIO will persist data
- Launch the MinIO container using Docker
Note: Keep a copy of the credentials used above, you will need them later to access MinIO.
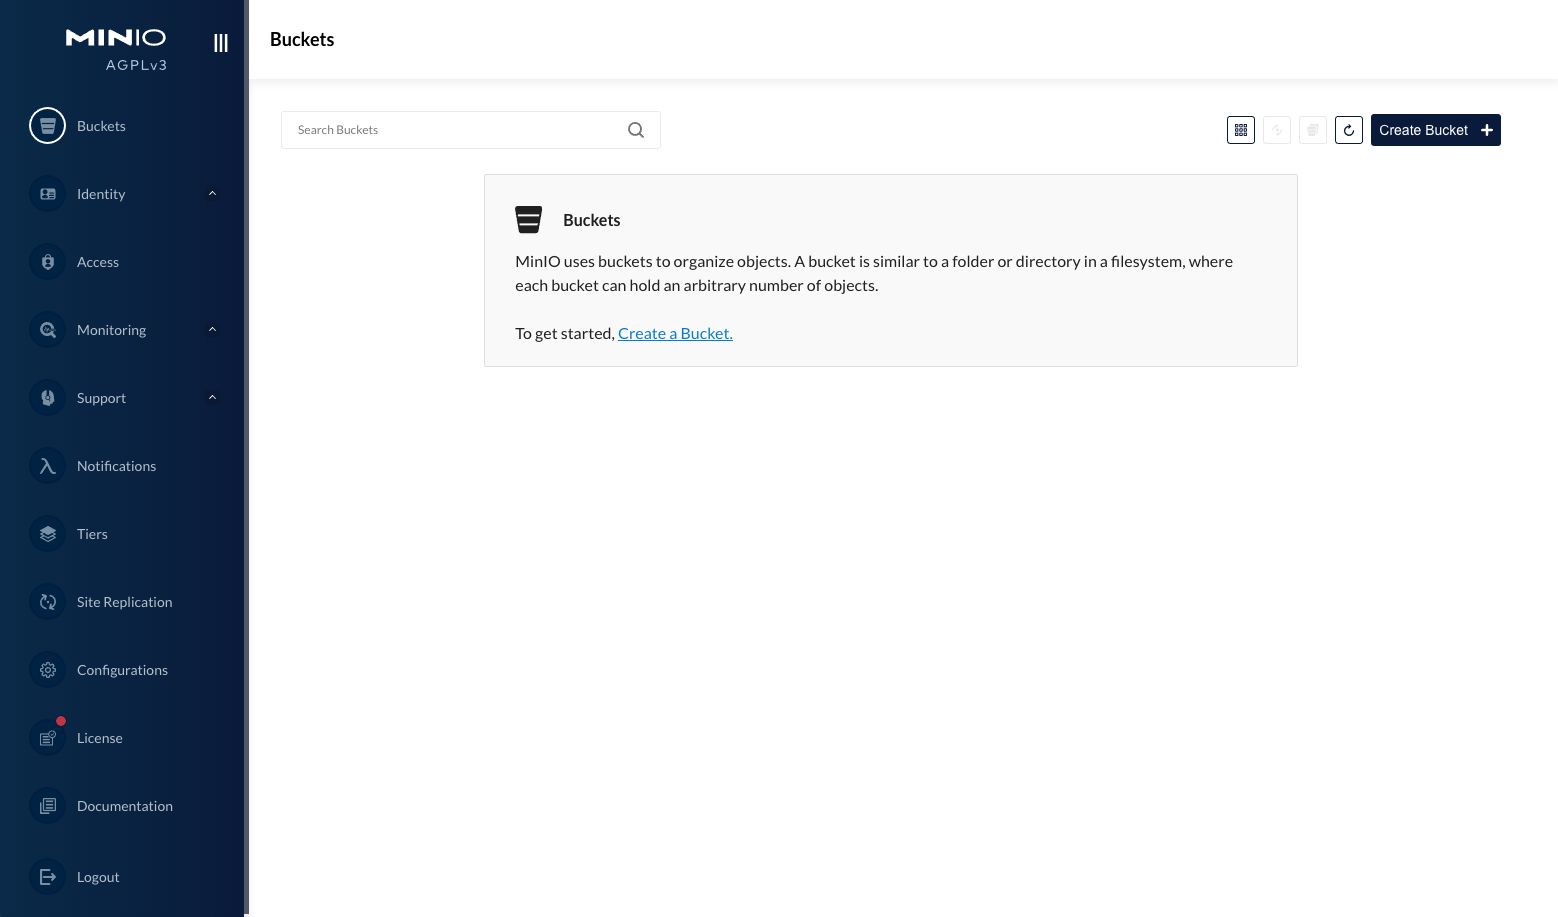
- Verify you can access MinIO by logging in using a browser through http://localhost:9001/ with the credentials used to launch the container above.
MinIO SDKs
There are several SDKs that are supported for you to integrate your app with the MinIO API. In this example we’ll use the Python SDK.
- Install the MinIO Python SDK
- Copy and paste the entire Python script with the included MinIO functions into a local text editor and save it as
minio_app.py. You can refer to it as we describe what it does below.
Let’s walk through the above script. We are invoking some basic operations with the MinIO container we launched in the previous step.
At the very top we’re importing the MinIO Python SDK that we installed earlier and initializing it with default values for
- MinIO endpoint
- MinIO username
- MinIO password
- Destination bucket name in MinIO
- Check if the specific destination bucket exists; if not create it.
- Create a test object to do basic operations with. Here we’re creating a file with some text
- Put the test object in the bucket we created earlier
- Get the test object we added in the previous step. On the machine where you are running the script, we’re placing the file at
<bucket_name>/<file_path>so it doesn’t conflict with the original
- Get the list of objects in the bucket to confirm our file made it there
- The output would be something like below. The file we added is shown as a Python object. Now we know that the object is there.
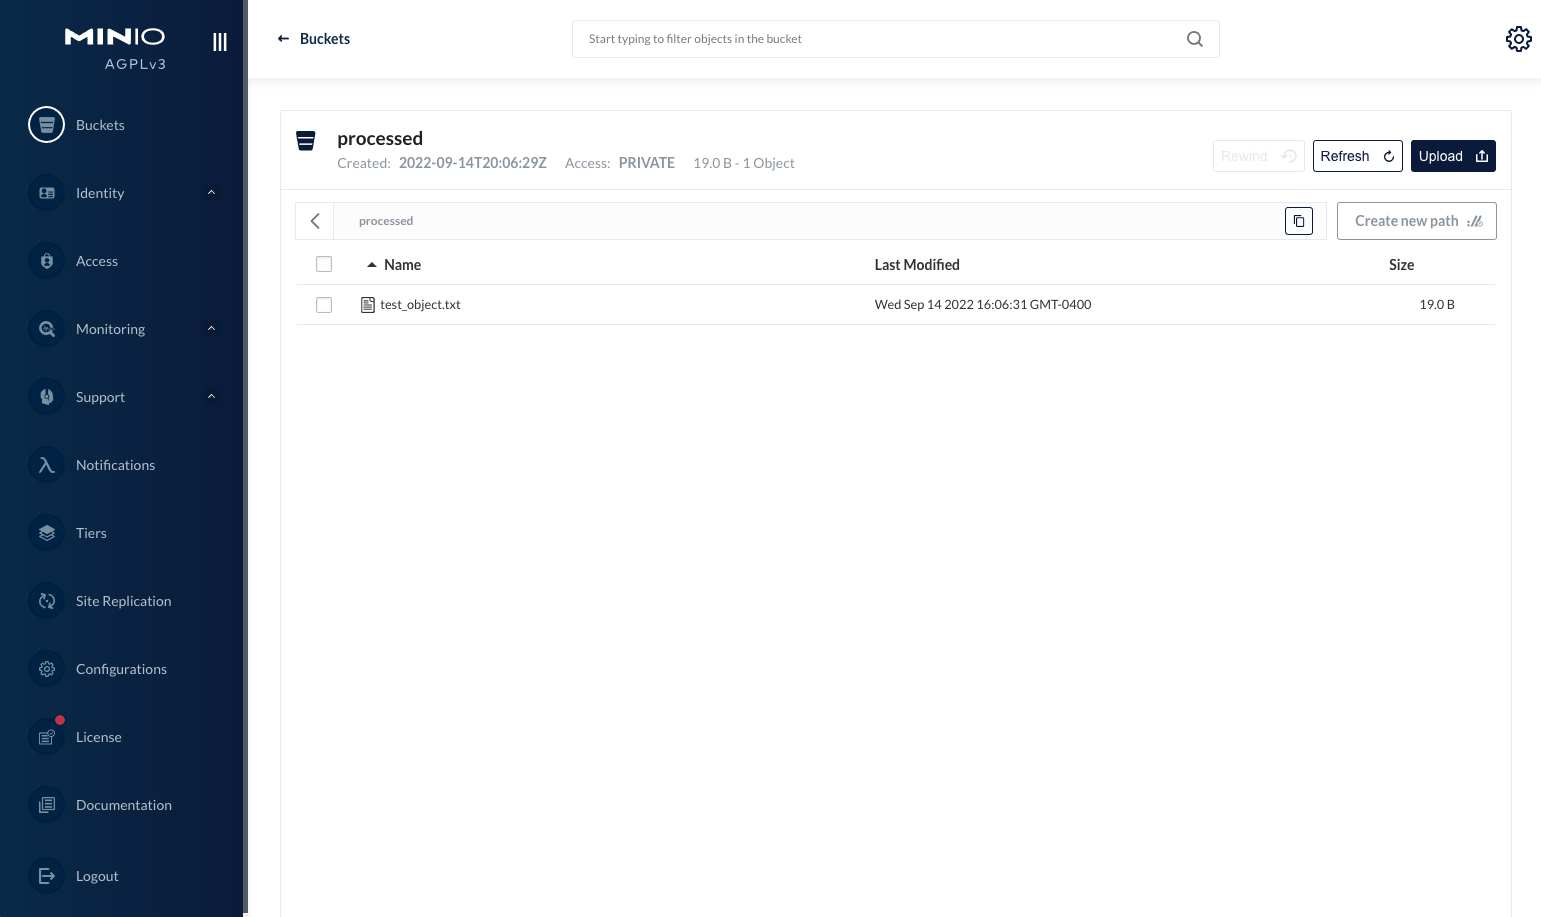
- Run the script using the command below. You should see the new object in the bucket.
- This can be verified through the console UI in browser on
http://localhost:9001.
- Now that we have the object on the machine where you ran the script, let's delete it from our MinIO bucket and verify that no other objects are there.
- Since that was the only object, now we can delete the bucket we created earlier
Remember that we’re using a very simple app using the MinIO SDK for this tutorial. From this, you can easily see how to include tracing in your own app. While it's ideal to add tracing when building your app, it's never too late to add it and take advantage of the insight that it provides.
OpenTelemetry
OpenTelemetry is a framework that allows you to take traces, metrics, and logs from your app and standardize them in a way that they can then be consumed by a number of exporters, such as Jaeger.
Installing OpenTelemetry
Like MinIO, OpenTelemetry supports a number of SDKs. Some are more feature rich than others, but one of the SDKs that has been built with all the features is the Python SDK. There are two Python packages we need to install
Initialize OpenTelemetry
Once the required packages are installed, import them to the minio_app.py script we started in the previous section.
- Import the following packages
- Set the service name in the resource attributes so traces are easy to find when searching for them. We named the service
my-miniobut you can name it anything you want. This code accomplishes that and initializes the trace
We’ve created all the building blocks; now let's create a span that we can observe. But what is a span? In simple terms, a span is nothing but the start and end of a single request made by the function. There could be parent and child spans; together these form a trace.
Creating a span
One of the first requests we make is to check whether the bucket exists. Let’s create a span for it
At this point the script should look something like this
The spans can emit to multiple exporters but to start we’ll just emit our traces to the CLI. If you run the script above you should see a JSON output at the end, like below. This is your trace.
Each span can be customized in a number of ways by adding additional attributes. Let’s add an attribute function.name with value CHECK_BUCKET
If you rerun the script again, in the output you’ll notice there will be a new attribute
You can also add events to further enrich the trace
Run the script again and you’ll notice two new events in the JSON output
Adding more spans
So far we’ve only added one span. To make this more useful let’s add some more spans along with additional attributes and events. Generally adding more spans will not degrade the performance of the app since these are asynchronous requests.
With that in mind, here is the script updated with a few additional spans
These are just a few examples; you can go as detailed as you want to make your traces helpful to your team. You can measure
- The performance of database calls
- Processing time and performance for AI/ML jobs
- Latency when connecting to external services
Jaeger
But there is an issue: If you try to run the script now, it will run, but you will be hit with a wall of text that might be far longer and more complex (and therefore not as helpful) than if there was only a single span. In order to make sense of these traces we need a tool that will collect and process them.
There are many tools you can use but Jaeger is one of the most popular ones. It's very easy to get up and running like MinIO, and like MinIO, is very feature rich in order to help you do things like root cause analysis and service dependency analysis, among other things.
Installing Jaeger
We’ll deploy Jaeger as a Docker container and expose the necessary ports
- Installing the Jaeger container
- The above will expose two ports on
localhost
6831: the thrift server port, which is the inbound port for accepting traces
16686: the Jaeger UI for you to visualize the traces
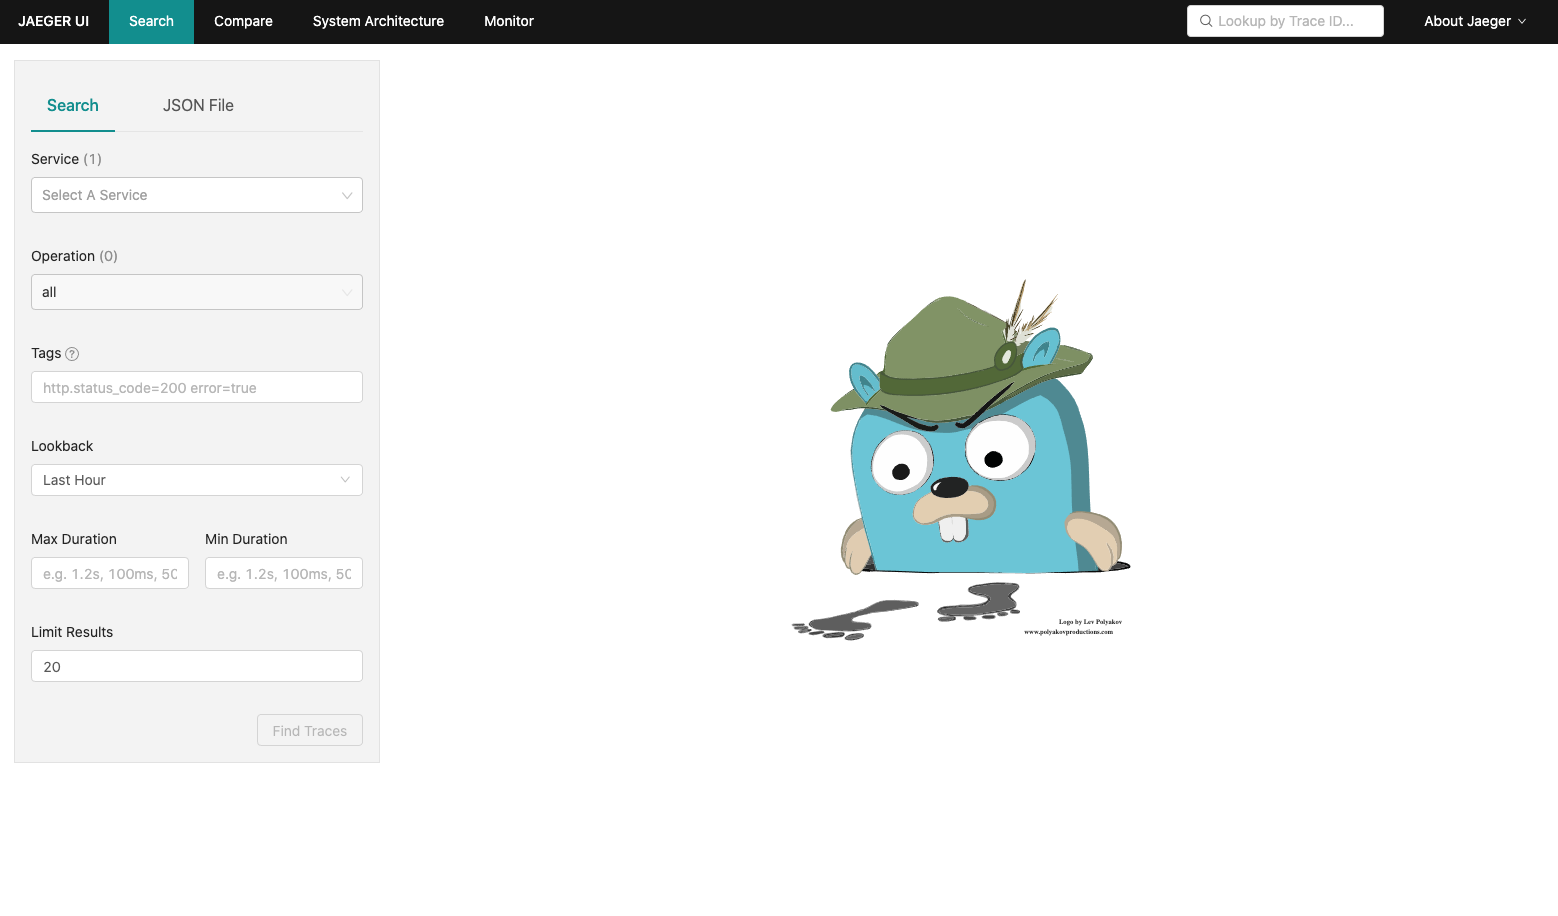
- Go to http://localhost:16686/ to access the Jaeger UI
Configuring Jaeger
At the moment our traces are emitting to the CLI. Now we’ll slightly modify the Python script to emit them to the Jaeger container we just created.
- Install OpenTelemetry’s Jaeger exporter
- Import the package in Python by replacing the following line
with
- Add the Jaeger exporter host information
- Replace the following line
with
- The end result would look something like this
Using Jaeger
Rerun the script. Instead of seeing a JSON blob emitted (remember our wall of text), go to the Jaeger UI and on the left you will see the my-minio service. Select it and then click Find Traces.
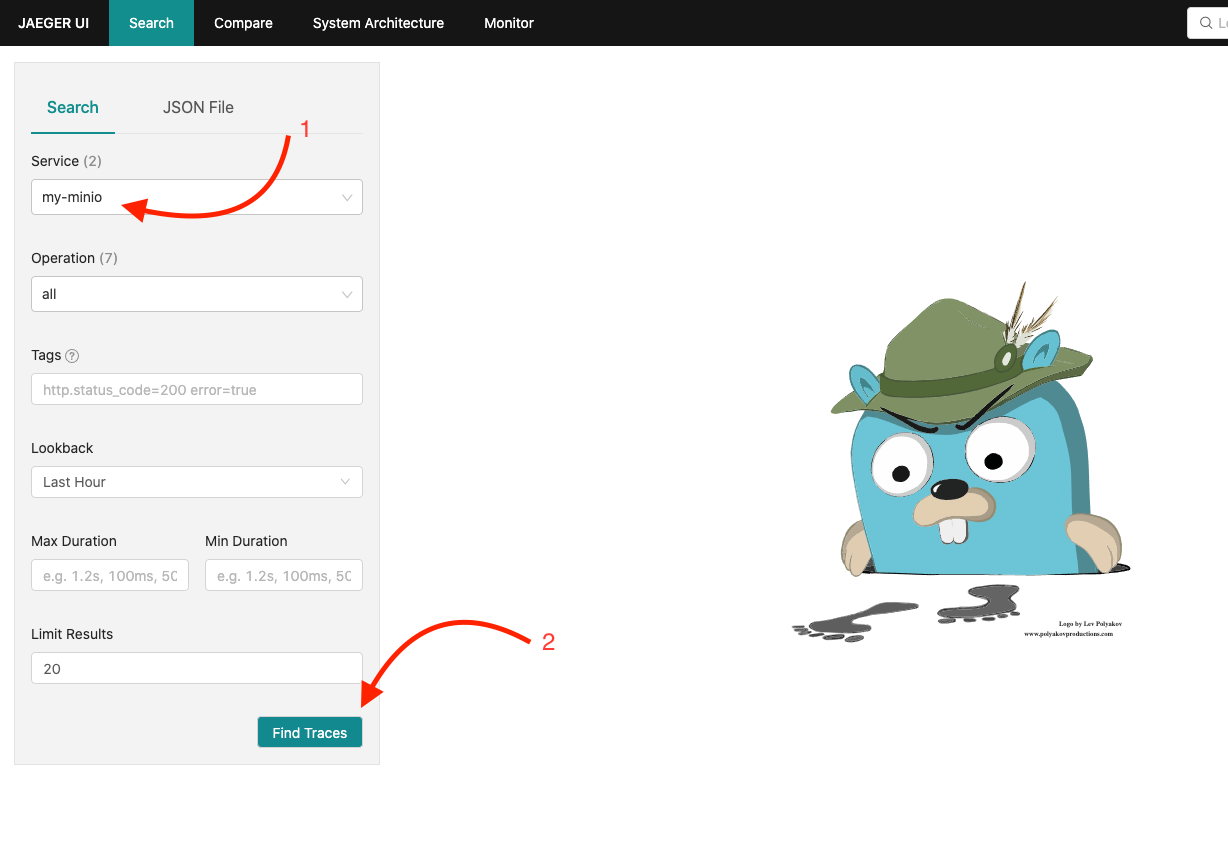
So far we’ve only made one request, and there should be a couple of traces from the few spans we created.
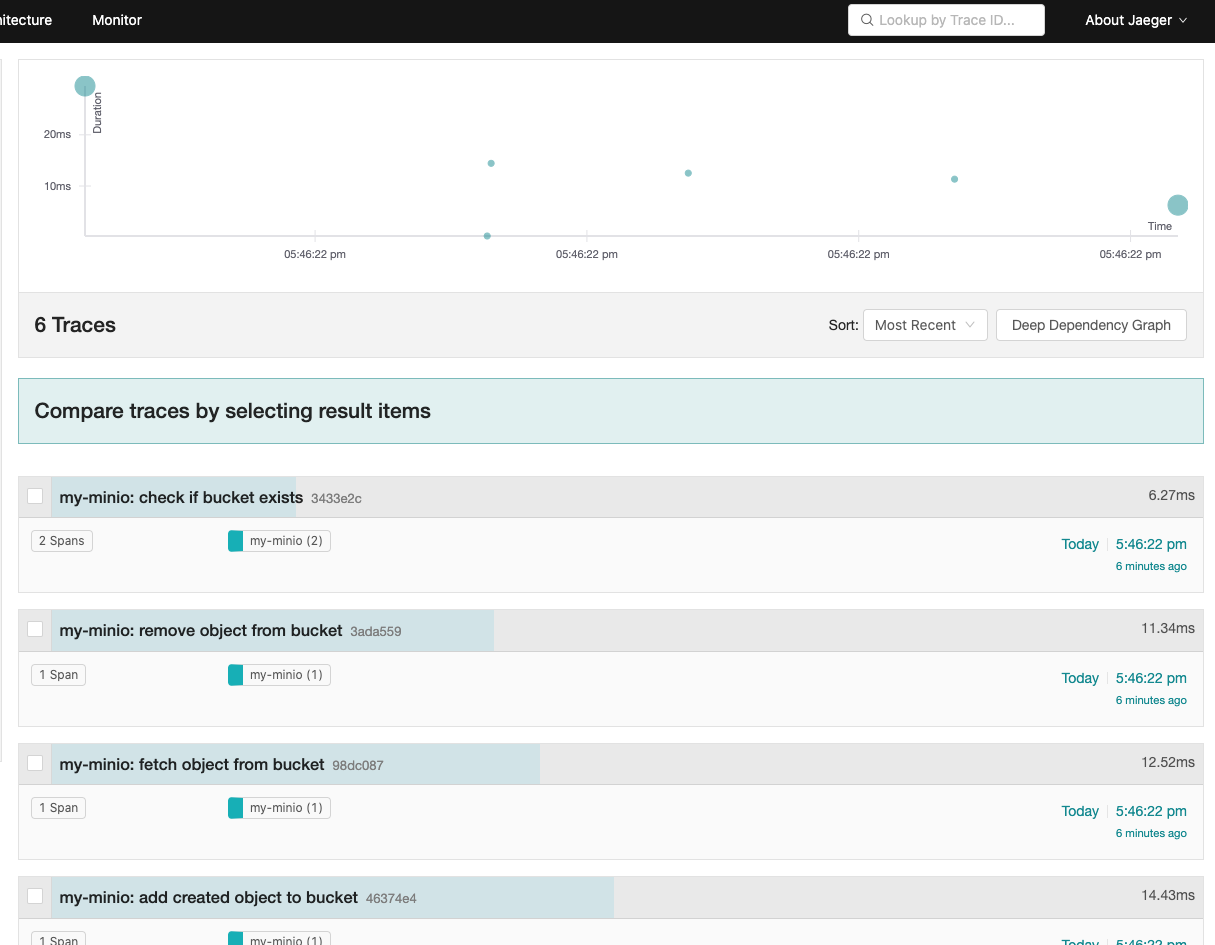
Click on one of the traces which shows 2 Spans; let's choose the one that says “check if bucket exists”. You can see all the details in a much more consumable way than just a JSON blob, forever banishing the wall of text and retaking our efficiency.

After running the script five to six times, we can start to see patterns emerge. The time you see above is the time it took for the different spans to execute. We are seeing two spans here because if you recall we added two parent and child spans. This is not only visually more appealing than a monster JSON blob, but it is also more helpful.

You can then send this data from Jaeger to Grafana so you can get historical graphs and can even set up alerts based on certain thresholds. For example, if an AI/ML job is taking longer than ten milliseconds to execute its function, then alert based on the thresholds set. It doesn’t matter which environment your apps are running in; you can ensure you can keep a watch with a single pane of glass.
Once we have the traces, you want to build a library of historical data that you can look back at to see trends and correlations. This is where metrics would come in handy. OpenTelemetry supports an entire cache of metrics and logging frameworks that are worth checking out.
Distributed tracing speeds troubleshooting
Tracing is just one of the pieces in the path towards observability. Generally when incidents happen it's not just one trace or one log or one metric that we use to determine and resolve the issue. Often it is understanding the combination of these things that is required to get to the root cause.
Observability opens the door for automation. We are big fans of automation, but in order to efficiently operate at cloud scale, you need to have a solid foundation and visibility into your logs and performance of applications.
If you need any help with MinIO’s Python SDK or how to implement tracing in your MinIO app don’t hesitate to reach out to us on Slack.


