How To Deploy Grafana Loki and Save Data to MinIO

Grafana Loki is a log aggregation system that stores and queries logs from applications and infrastructure. Although commonplace, logs hold critical information about system operations and are a valuable source of debugging and troubleshooting information. Logs are frequently used to identify and track malicious activity, or simply to track user activity to provide business intelligence.
In an earlier blog post, Logging with Grafana Loki and MinIO, we provided an overview of Loki’s components and their overall architecture. Think of Loki for logs as analogous to Prometheus for metrics. Loki is lightweight and cost-effective because it only indexes and queries metadata. Promtail agents collect, label and transform logs before sending them to Loki. Then Loki indexes metadata and groups entries into streams that are indexed with labels. Grafana is then used to visualize and query log information from Loki. As of version 2.0, Loki stores data in a single object storage backend, such as MinIO. Whereas the previous blog post explained the advantages of saving Loki data to MinIO, this blog post is a tutorial that teaches you how.
First, we’ll teach you how to deploy Loki and MinIO using Docker containers, followed by instructions on how to install from source.
Learn Loki and Master MinIO Using Docker Containers
We built a demo using Docker containers, some scripting and a Git repository. We started with the Grafana Loki repository, and added configuration yaml and containers for MinIO and a script to create and expose a MinIO bucket for Loki data. The following steps will result in these five images running locally in Docker containers:
- Loki
- Promtail
- Grafana
- MinIO
- Create buckets
The first three are obviously needed for Loki, Promtail and Grafana. They were already available from Grafana under the Loki repository (there is a short video explainer). MinIO is object storage for Loki, and the final container will run a script that creates buckets as Loki targets.
Loki has been configured to save log data to MinIO using loki.yaml. Of particular importance is the section:
Note the dot in the S3 address for MinIO. This is used because there is no need to specify AWS Region.
We create a Docker environment using the docker-compose.yaml file. We will configure containers, volumes, ports, networks and provide startup commands.
In order for the loki image to run as a container with access to Loki configuration via volumes:
The first configuration you’ll need to make is to make sure that your local folder of production is being shared with the container. Please edit the volumes section of your docker-compose.yaml to refer to the local folder on the host system where you have downloaded the production folder. We are mapping the host path to the container path in order to read loki.yaml.
In docker-compose.yaml, we also define a network and expose ports of the container running MinIO server. In this case, port 9000 and 9001 will be exposed to your local machine in order for you to access MinIO server with a browser.
We configure the network with all containers sharing a loki network. Each container can ping the others and use their APIs. Don’t use fixed IP addresses for your containers. To make it easier, we’ve configured loki and minio in our environment to resolve to the appropriate container. For example:
The next action taken by docker-compose.yaml is to run MinIO Client (mc) in a container to configure MinIO Server, create the destination bucket for Loki data and set the access policy to public as required.
Promtail, a small Go program, is used to tail or collect the distributed log files and deliver them to Loki. For this demo Promtail is deployed in its container with a configuration file that scrapes the /var/log directory. No changes are required in order to run this demo and have it process the log files at that location - /var/log.
At the end of this tutorial we will cover how to have Promtail scrape other locations on the system for log files.
Steps
Now that you understand how to configure Loki, Promtail and your Docker environment, please follow these steps to configure and run the demo environment. The following steps use the docker-compose.yaml, loki.yaml and the default Promtail configuration to demonstrate how Loki works with MinIO. After downloading our files, edit them for your environment.
Clone this repository https://github.com/cniackz/loki:
Change directory to your local production folder:
https://github.com/cniackz/loki/tree/main/production
Build your local Docker environment:
Launch local Docker containers:
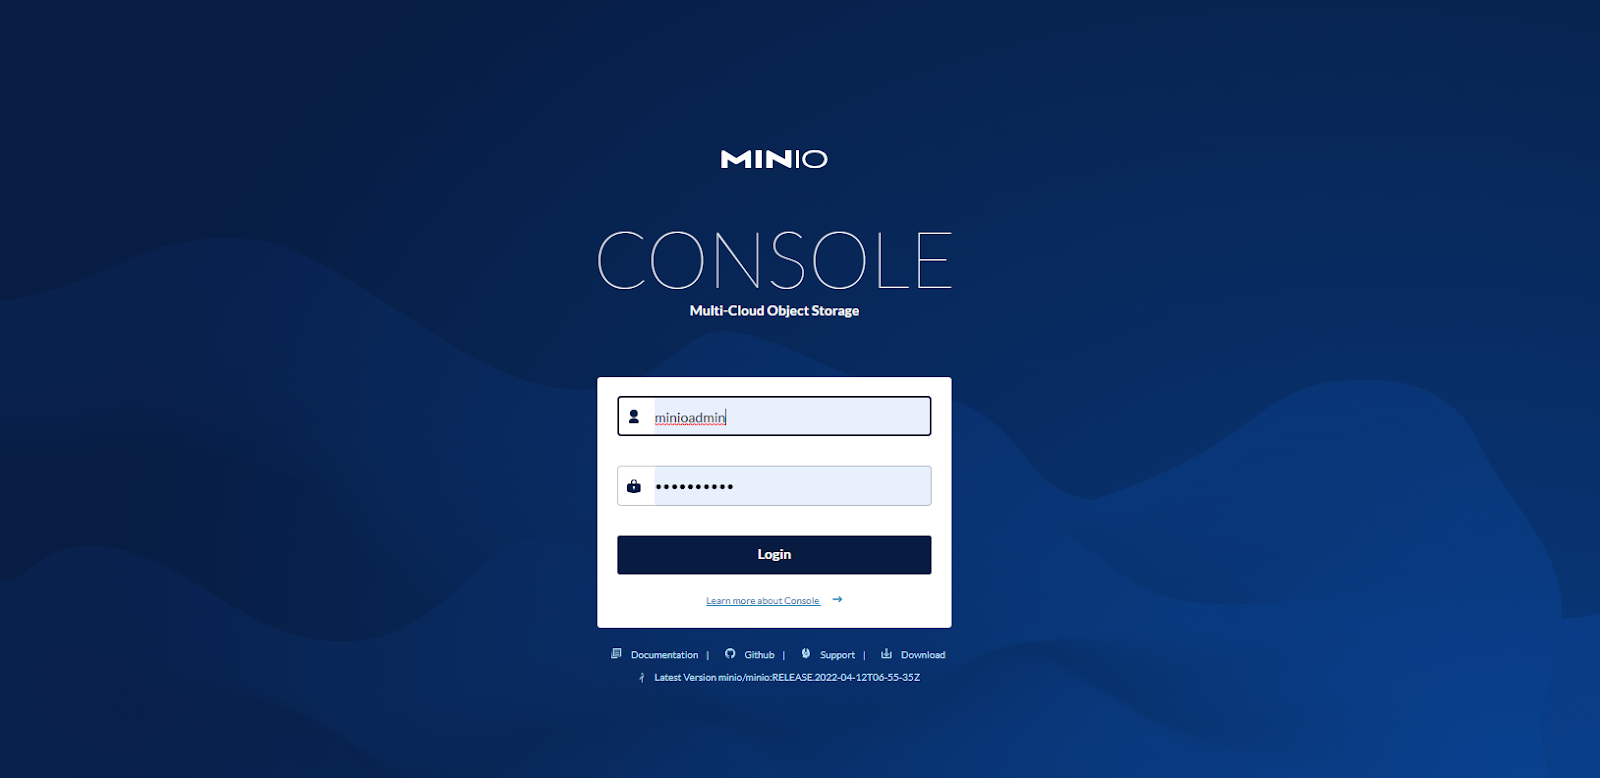
To confirm that Loki data is being saved to MinIO, log into MinIO Console at http://localhost:9001 or http://minio:9001. This tutorial uses the following credentials:
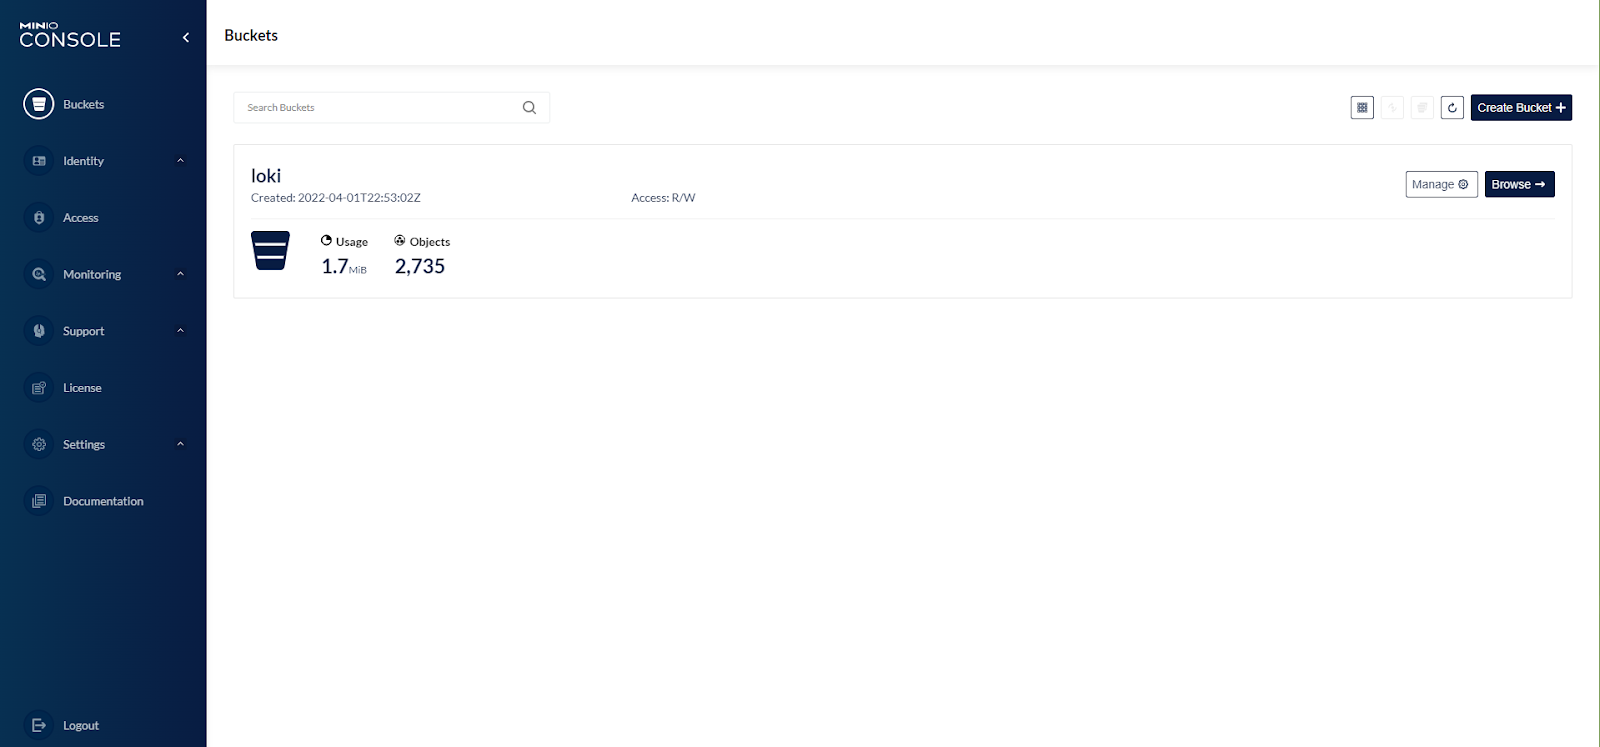
After logging in, click Buckets. You should see that the Loki bucket has been created.
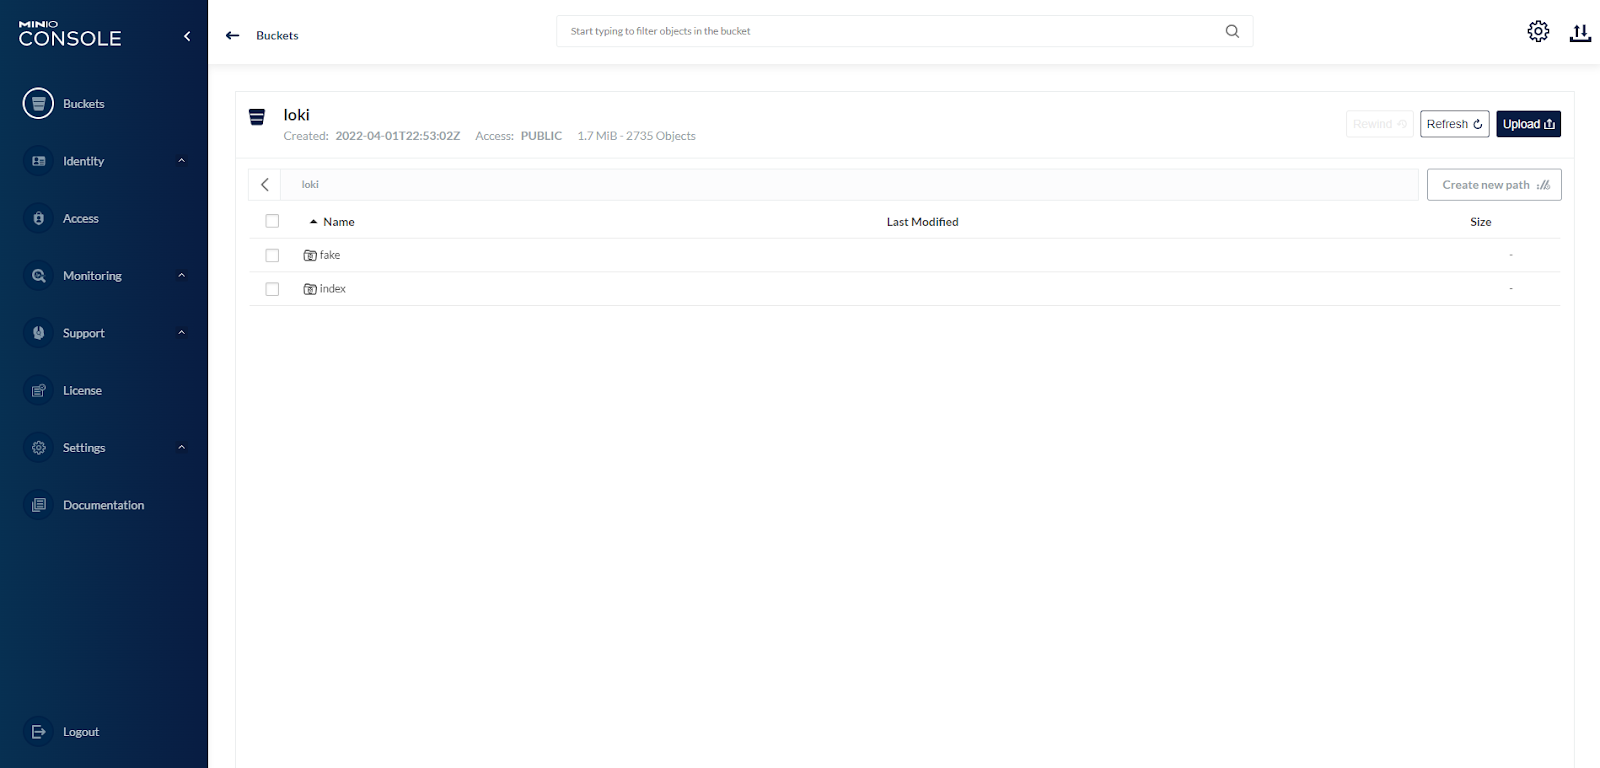
On the right side, click Browse to see the contents of the newly created bucket. You should see the fake directory under loki. This is where Loki will save data.
Click its name to open the fake directory. Loki holds logs in memory for a configured interval and then writes them to object storage. The default is an interval of 5 minutes, so please wait 5 minutes for data to appear in your bucket.
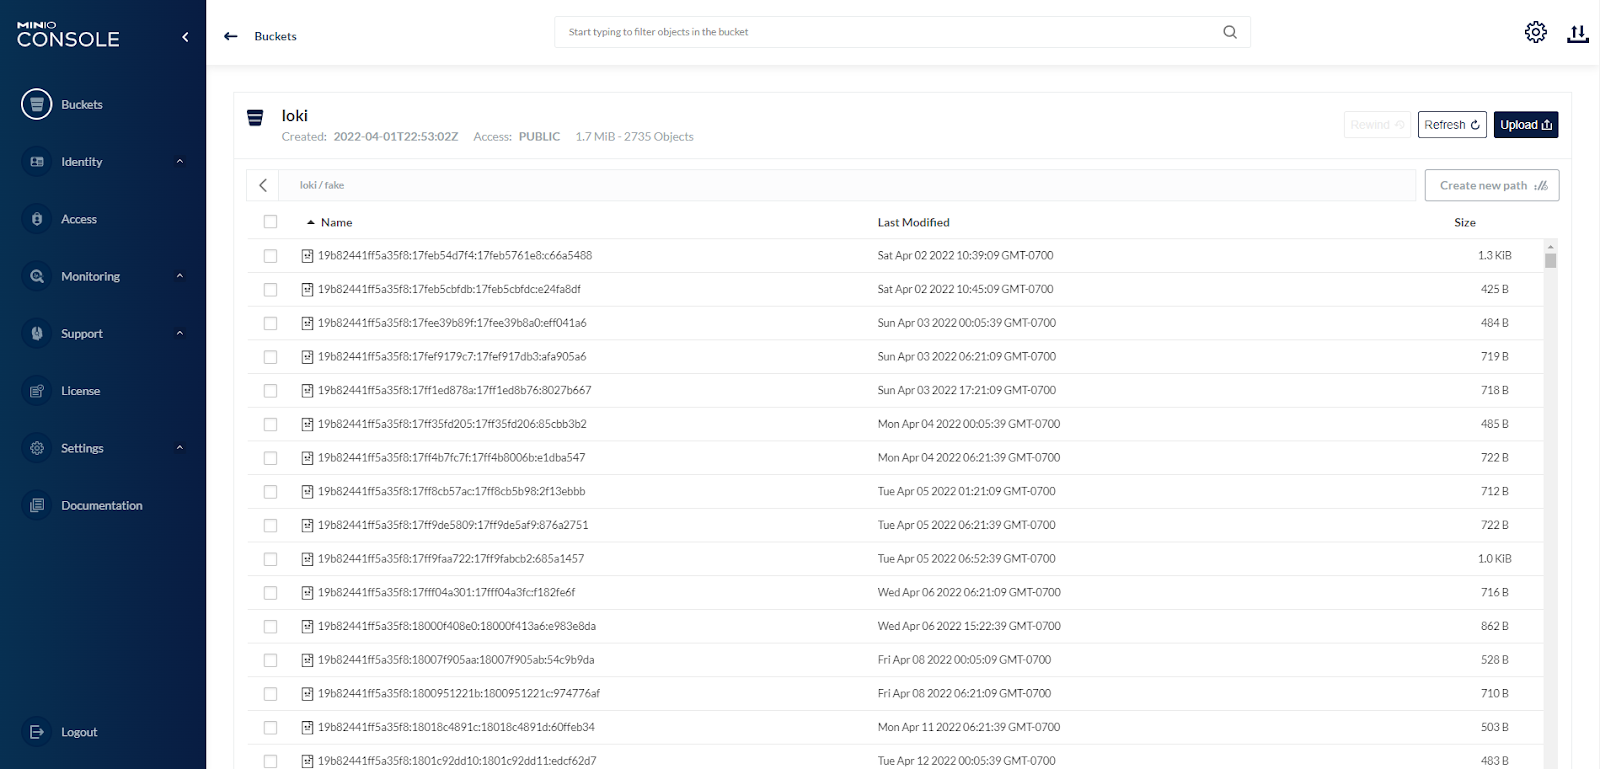
At this point, Promtail is sending logs to Loki and Loki is saving data to MinIO. Now, let’s set Grafana up to view Loki logs. Grafana 6.0 and higher include built-in support for Loki. Grafana 6.3 and higher includes support for LogQL functionality.
Log into Grafana at http://loki:3000 (default credentials are admin:admin).
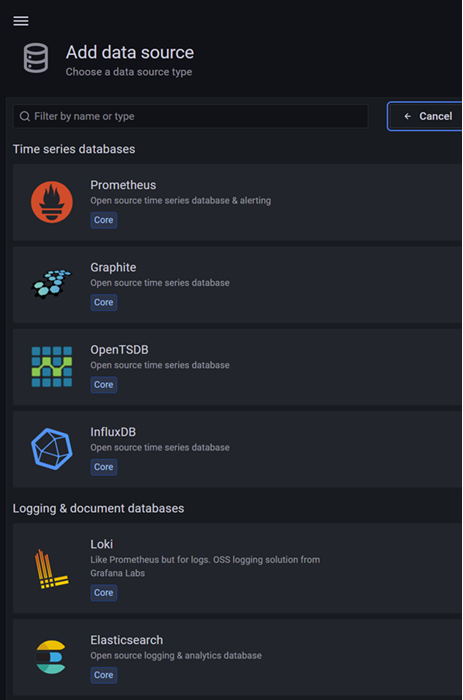
In Grafana, click the cog icon on the left sidebar to go to Configuration and then Data Sources. Click the big Add Data Source button and then select Loki.
Edit the http URL field to be for our Loki server running locally using Docker port mapping: http://loki:3100.
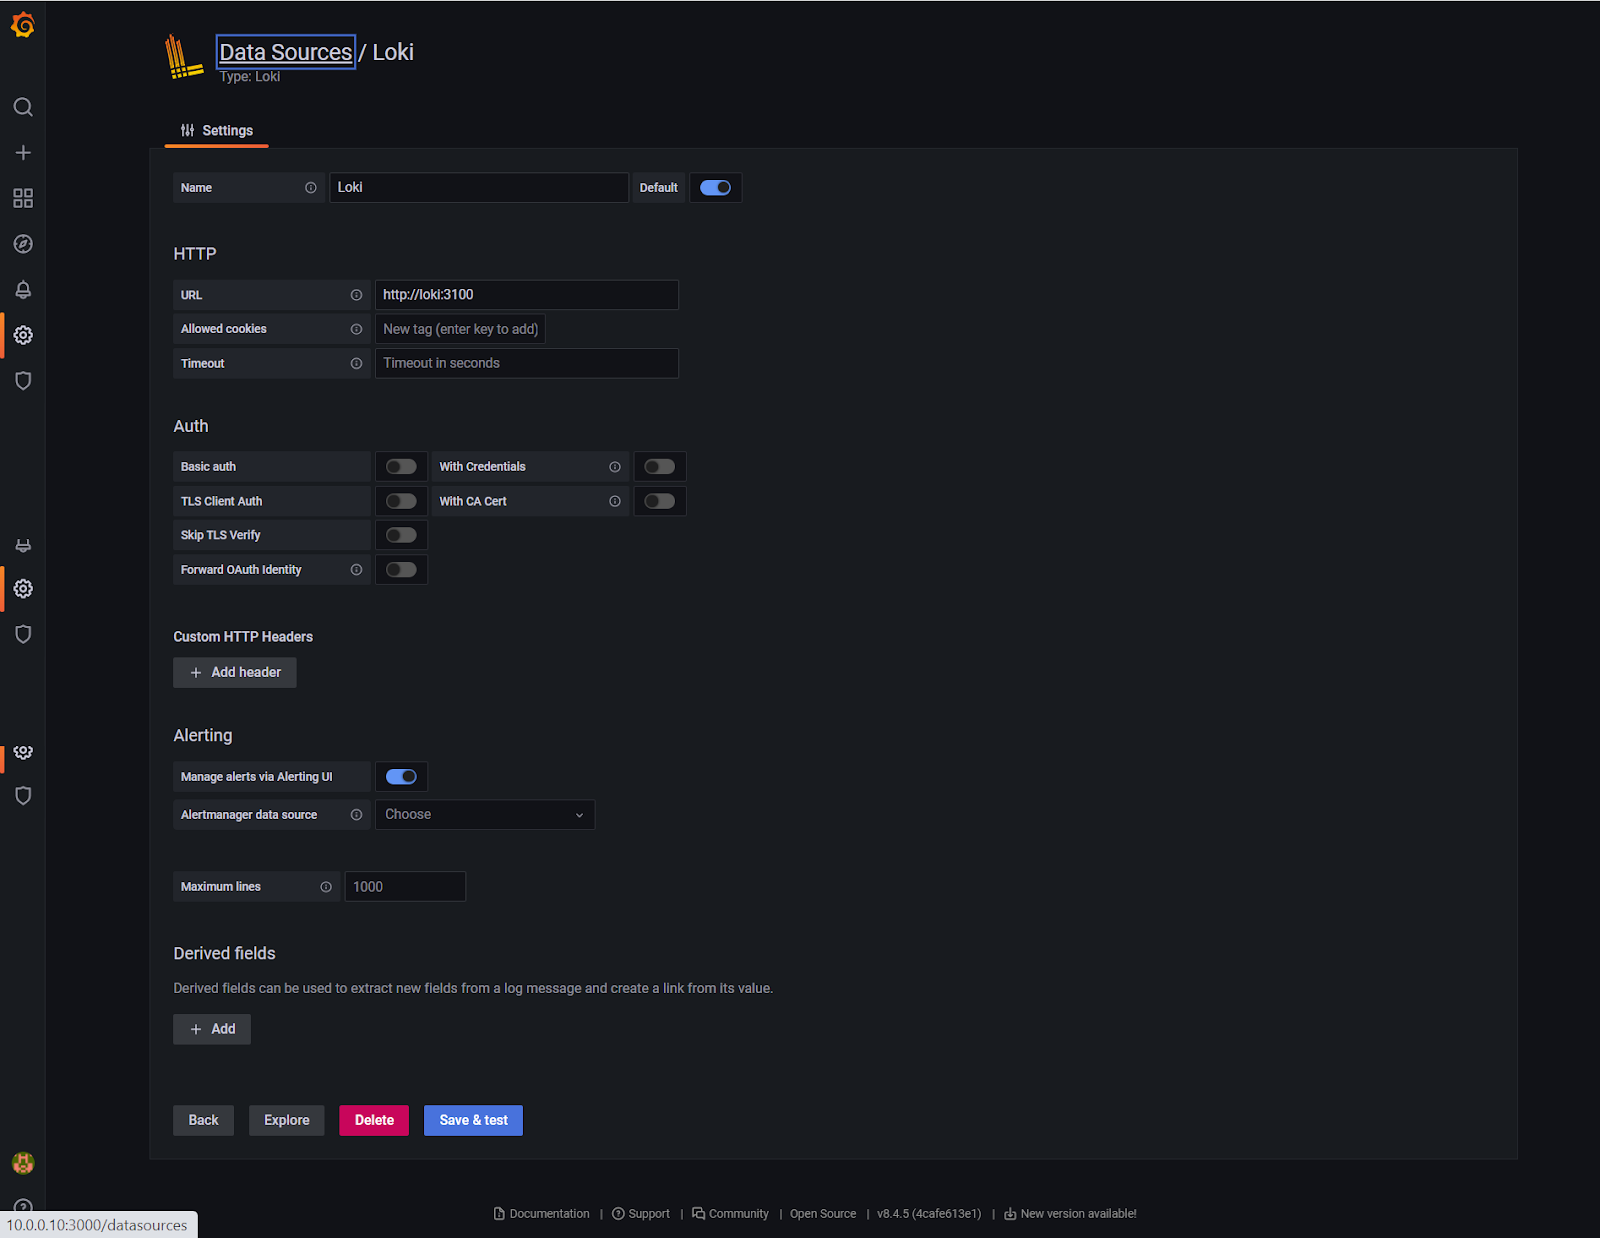
Then click Save & Test.
To view logs immediately, click explore. You can also view logs by clicking Explore in the left sidebar. However you explore, then select the Loki datasource in the top-left dropdown, and then choose a log stream using the Log Labels button.
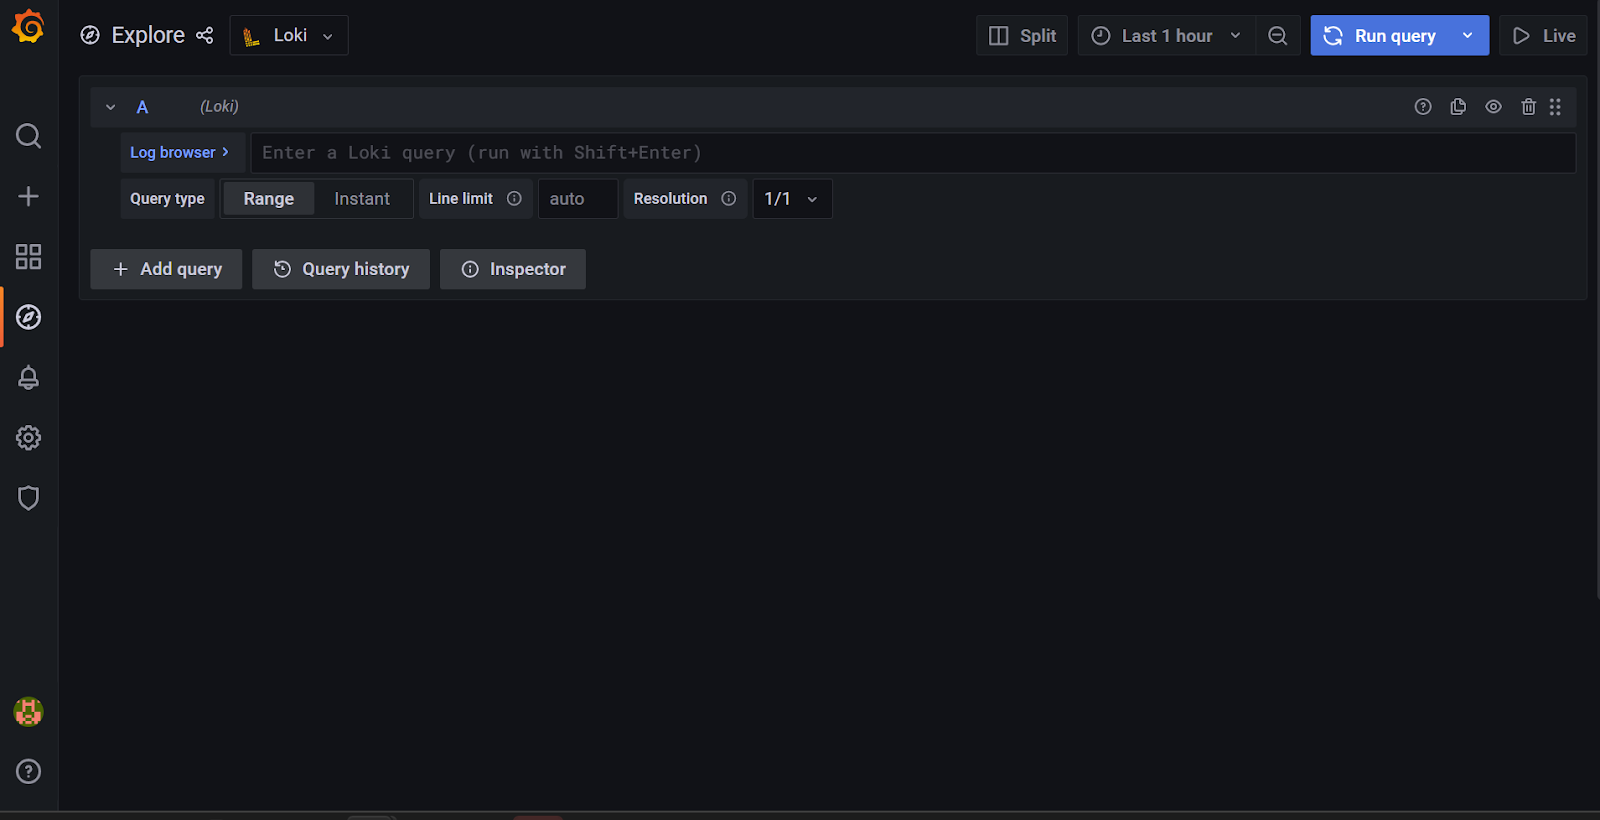
You can type a LogQL query and click on Run Query. However, if you don’t yet know LogQL, you can use the GUI to select a log and query parameters.
To quickly see the logs that are in Loki, click Log browser, then under 1. Select labels to search in and choose job, then under 2. Find values for the selected labels click the name of your job (from promtail-local-config.yaml). In this case I’ve clicked on varlogs. Then click the Show Logs button.
You can select the time range and set the refresh interval of the query on the top right of the browser window.
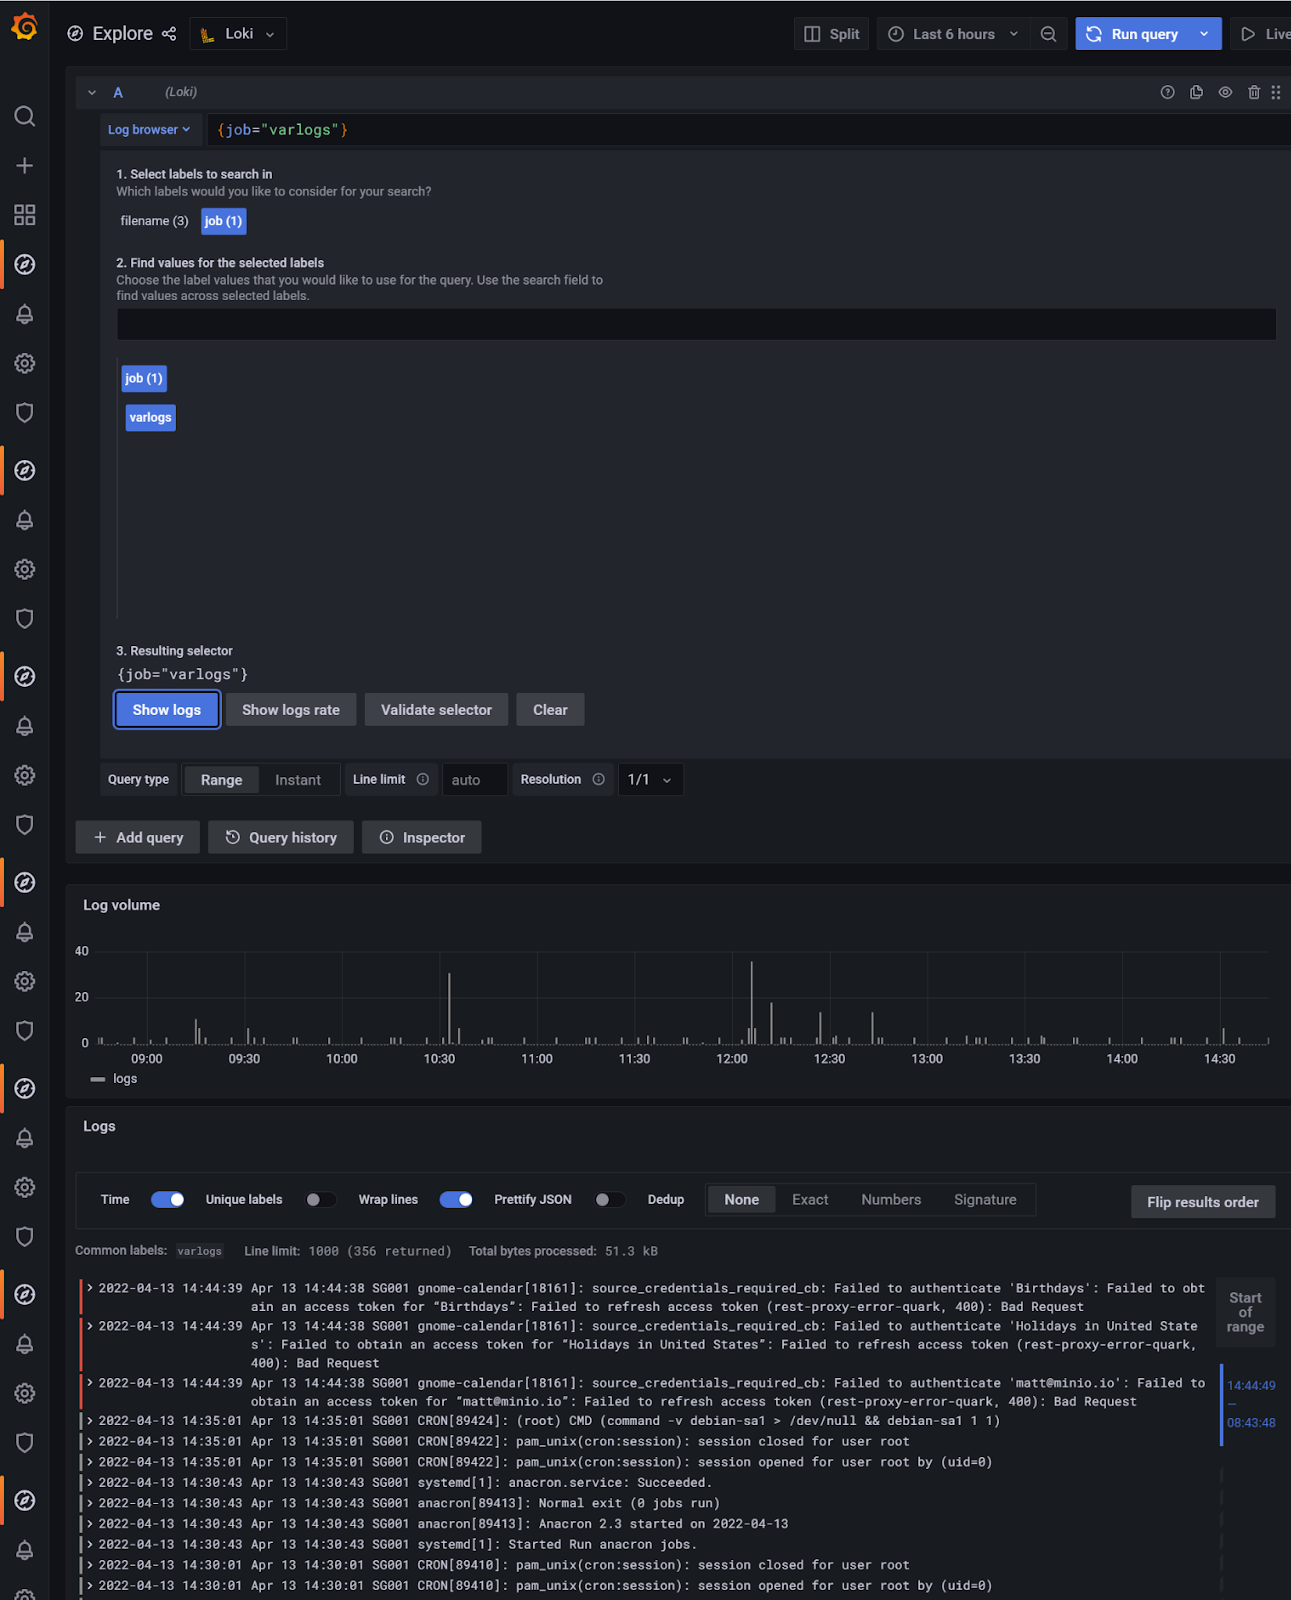
To see more details of the logs, scroll down and click on one of the log entries, it will provide additional information related to the log entry.

A really powerful feature is the ability to filter or see statistics about labels and fields directly from log details by clicking on the icons. This simplifies troubleshooting as it makes it easier to look for recurring errors and pivot between search terms.
Extending the Demo
Once the demo is running, the next step is to have Promtail scrape a different set of files that might be more interesting for your use case. In order to do this we need Promtail to run using a configuration file that we can edit. One way to achieve this is using volumes in Docker.
Edit the docker-compose.yaml file to create 2 new volumes accessible from the Promtail container. The first provides access to the directory on the host system where the new config file will be created. The second provides access to a directory that will contain the log files of interest. Additionally, Promtail will be launched referencing the new config file, which we have called promtail-local-config.yaml:
version: "3"

networks:
  loki:

services:
  loki:
    image: grafana/loki:latest
    volumes:
     - <your-local-path>/loki/minio-loki-tutorial/production:/home/loki/production
    ports:
      - "3100:3100"
    command: -config.file=/home/loki/production/loki.yaml
    networks:
      - loki

  promtail:
    image: grafana/promtail:2.4.2
    volumes:
      - /var/log:/var/log
      -- <your-local-path>/loki/minio-loki-tutorial/production:/home/loki/production
      -- <your-local-path>/access_logs:/home/loki/access_logs
    command: -config.file=/home/loki/production/promtail-local-config.yaml
    networks:
      - loki

  grafana:
    image: grafana/grafana:latest
    ports:
      - "3000:3000"
    networks:
      - loki

  minio:
    image: minio/minio:latest
    ports:
      - "9000:9000"
      - "9001:9001"
    networks:
      - loki
    command: server ~ --address ':9000' --console-address ':9001'

createbuckets:
    image: minio/mc
    networks:
      - loki
    depends_on:
      - minio
    entrypoint: >
      /bin/sh -c "
      /usr/bin/mc config host add myminio http://minio:9000 minioadmin minioadmin;
      /usr/bin/mc rm -r --force myminio/loki;
      /usr/bin/mc mb myminio/loki;
      /usr/bin/mc policy set public myminio/loki;
      exit 0;
      "
There’s a lot more that you can do with log data in Grafana. For starters, you can install promtail in more places to tail more logs to Loki. Copy the executable and promtail-local-config.yaml to other machines/instances/containers, edit the configuration as described in Promtail Configuration and run it.
We now need to create the Promtail config file, promtail-local-config.yaml to send local system logs to Loki. Download and edit a sample config file from Grafana. The section to focus on is scrape_configs because this is where promtail is told which logs to pull, how to format them and where to send them. Please see Get logs into Loki for more information about configuring promtail.
The scrape_configs section includes the following:
- job_name - This differentiates the logs collected from other log groups.
- targets - Optional for
static_configs. However, is often defined because in older versions of Promtail it was not optional. This was an artifact from directly using the Prometheus service discovery code, which required this entry. - labels - Static label to apply to every log line scraped by this definition. Good examples include the environment name, job name, or app name.
- path - The path to where the logs that Loki is to consume are stored.
server:
  http_listen_port: 9080
  grpc_listen_port: 0

positions:
  filename: /tmp/positions.yaml

clients:
  - url: http://loki:3100/loki/api/v1/push

scrape_configs:
- job_name: apache
  static_configs:
  - targets:
      - localhost
    labels:
      job: access_logs
      __path__: /home/loki/access_logs/*log
It’s important to understand different configuration options for scraping in Promtail, and Grafana provides plenty of details.
It may be helpful to consult the full promtail configuration reference to see the application’s full capabilities.
Finally, place some Apache web server access logs in the directory specified in the docker-compose.yaml file on the host system. These are the logs that Promtail will ingest and send to Loki for processing:
-- <your-local-path>/access_logs:/home/loki/access_logsOnce the edits have been made and the sample Apache access logs put in place, bring the containers down and back up with docker compose:
docker-compose down
docker-compose up -d
Promtail will subsequently load the new Apache access log files and make them available to Loki.
The environment that we’ve created in this tutorial is helpful for getting started with Loki, but it is not production-ready. Next steps would be to leave Docker for Kubernetes and use distributed MinIO instead of a single instance. Eventually, Loki data gets big enough that it benefits from an external database for quick index searches. Please see Scalability - Scaling with Grafana Loki for more information.
Conclusion
The observability stack of Grafana, Prometheus and AlertManager gained a powerful addition with Loki (BTW, we also have a tutorial for Grafana, Prometheus and AlertManager on MinIO). Distributed systems, especially when containerized and orchestrated by Kubernetes, have many logs for their applications and microservices. Loki combined with MinIO is a cost-effective way to collect, store and query logs.
If you have any questions, please send us an email at hello@min.io, or join the MinIO slack channel and ask away.


