How to Run Grafana Mimir with MinIO for Persistent Metrics Storage

Distributed systems contain a lot of moving parts, and it is critical to monitor telemetry data such as metrics, logs and traces to gain visibility and allow teams to determine the root cause of an issue. The goal of many observability initiatives is to increase availability and performance. Grafana Labs makes one of the most widely used open source observability stacks (Grafana for visualization, Loki for logs, Mimir for metrics, Tempo for traces, Alertmanager for alerts), and sells Grafana Cloud and Grafana Enterprise.
Grafana Mimir is an AGPLv3 licensed open source software project that, when coupled with MinIO, provides scalable, long-term storage for Prometheus metrics. Mimir was built using a microservices-based architecture that is horizontally scalable. Each microservice is referred to as a component, and Mimir runs as a single binary made up of these components. Most components are stateless and do not require any data to be persisted between restarts.
When you combine Mimir and MinIO you produce an infrastructure that is particularly well suited to meet the needs of enterprise cloud-native observability with:
- Performance: MinIO’s combination of scalability and high-performance puts every workload, no matter how demanding, within reach. MinIO has created a comprehensive blueprint for data infrastructure to support exascale AI and other large scale data lake workloads. It is called the MinIO DataPod. Why? Because exascale data is the reality that is common today in today's enterprise.
- Scale: MinIO knows no limit as it scales horizontally through server pools. Each server pool is an independent group of nodes with their own compute, network and storage resources. In multi-tenant configurations, each tenant is a cluster of server pools in a single namespace, fully isolated from the other tenants’ server pools. Capacity can easily be added to an existing system by pointing MinIO at a new server pool and MinIO automatically prepares it for and places it in service.
- Simplicity: If you’d rather put Mimir to use than spend hours fiddling with object storage, then you can’t find a more straightforward solution than MinIO. MinIO only serves objects - it is all we do and we’re obsessive about being the best. Other products combine object and file storage, which results in multiple storage layers that introduce latency to Mimir’s query response times and create a more complex architecture with greater chance of failure..
- Multi-Cloud: MinIO, born in the cloud, runs anywhere on any combination of hardware and software. A rich set of integrations means that MinIO transparently plugs into existing security and management tools and services to centralize identity management, encryption key management, and more. MinIO provides S3 API compatible object storage on baremetal or any version of Kubernetes - including GKE, EKS, AKS, Red Hat OpenShift, VMware Tanzu - and efficiently synchronizes data using active-active replication.
Some of the core strengths of Grafana Mimir include:
- Easy to install and maintain: Grafana Mimir’s extensive documentation, tutorials, and deployment tooling make it quick to get started. Using its monolithic mode, you can get Grafana Mimir up and running with just one binary and no additional dependencies. Once deployed, the best-practice dashboards, alerts, and playbooks packaged with Grafana Mimir make it easy to monitor the health of the system.
- Massive scalability: You can run Grafana Mimir’s horizontally-scalable architecture across multiple machines, resulting in the ability to process orders of magnitude more time series than a single Prometheus instance. Internal testing shows that Grafana Mimir handles up to 1 billion active time series.
- Global view of metrics: Grafana Mimir enables you to run queries that aggregate series from multiple Prometheus instances, giving you a global view of your systems. Its query engine extensively parallelizes query execution, so that even the highest-cardinality queries complete with blazing speed.
- Cheap, durable metric storage: Grafana Mimir uses object storage for long-term data storage, allowing it to take advantage of this ubiquitous, cost-effective, high-durability technology. It is compatible with multiple object store implementations, including AWS S3, Google Cloud Storage, Azure Blob Storage, OpenStack Swift, as well as any S3-compatible object storage.
- High availability: Grafana Mimir replicates incoming metrics, ensuring that no data is lost in the event of machine failure. Its horizontally scalable architecture also means that it can be restarted, upgraded, or downgraded with zero downtime, which means no interruptions to metrics ingestion or querying.
- Natively multi-tenant: Grafana Mimir’s multi-tenant architecture enables you to isolate data and queries from independent teams or business units, making it possible for these groups to share the same cluster. Advanced limits and quality-of-service controls ensure that capacity is shared fairly among tenants.
Mimir was developed to be the most scalable, most performant open source time series database available. Mimir easily scales to 1 billion metrics and beyond, with blazing fast query performance that is up to 40x faster than Cortex, the TSDB Mimir was built to replace. Cortex has been a CNCF project since 2018 and is widely used to store Prometheus metrics. When creating Mimir, Grafana Labs laid the groundwork for enterprise-ready observability with AGPLv3 licensing, access controls, and improved performance, scalability and availability.
Grafana Labs has a goal for Mimir: To be the best scalable time series database regardless of metrics format. Enterprises should be able to consume Prometheus metrics (and other metrics as other vendors collaborate) without modifying existing code.
Now that we’ve learned what Mimir is, let’s run through an introductory tutorial.
Grafana Mimir and MinIO Tutorial
This tutorial draws on an existing tutorial, Play with Grafana Mimir to show how easy it is to get started with Mimir using Docker.
Create a copy of the Grafana Mimir repository using the Git command line:
Navigate to the tutorial directory:
Start MinIO, Mimir, Prometheus, Grafana and NGINX
This will bring up the following:
- Grafana Mimir - three instances of Mimir for high availability. Multi-tenancy is enabled (tenant ID is demo).
- Prometheus - scrapes Mimir metrics, then writes them back to Mimir so they’re available
- MinIO - S3-compatible software defined persistent storage for blocks, rules and alerts
- Grafana - includes pre-installed datasource to query Mimir and pre-installed dashboards for monitoring Mimir
- Load Balancer - NGINX-based load balancer that exposes Mimir instances
The following ports are used:
- Grafana: http://localhost:9000
- Grafana Mimir: http://localhost:9009.
The components of our tutorial go together like this:

If you want to dig deeper into any configurations used in this tutorial, please see the YAML files saved to ~/mimir/docs/sources/tutorials/play-with-grafana-mimir/config/.
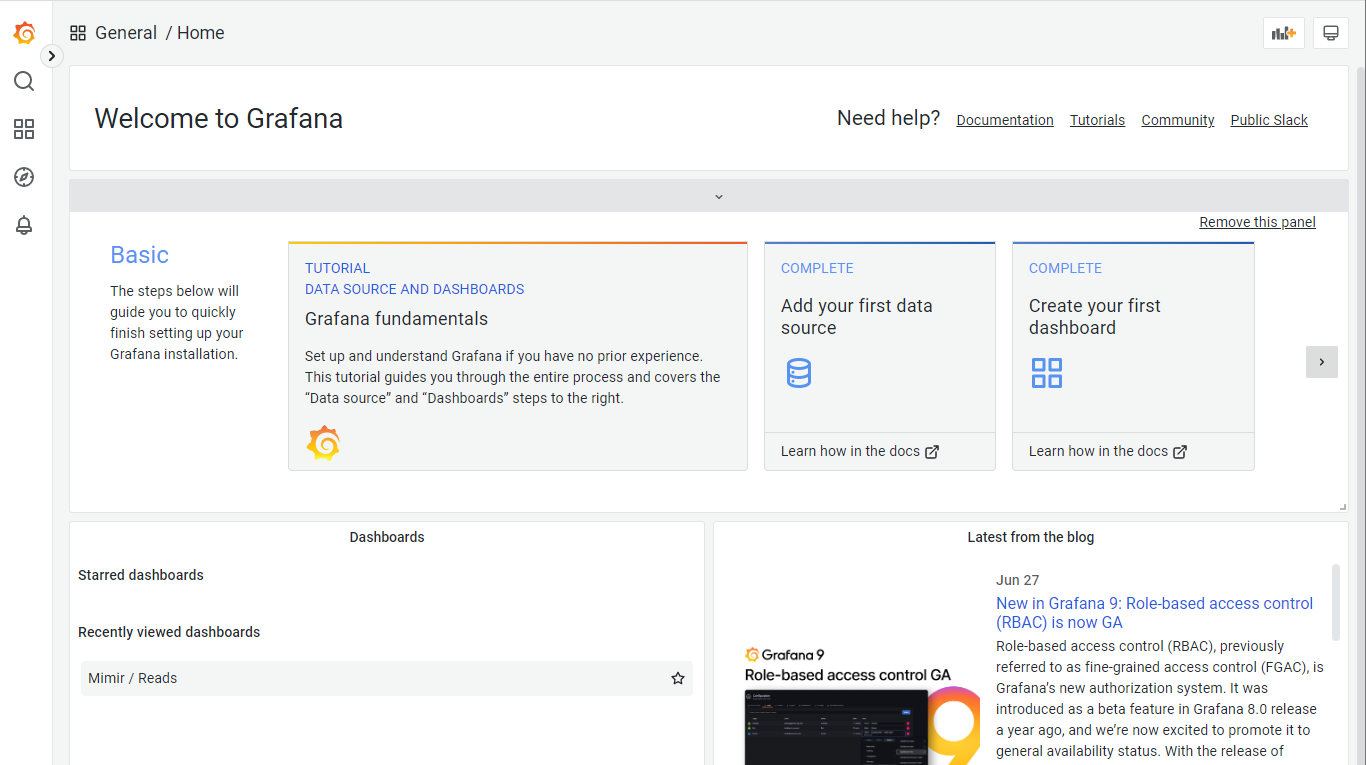
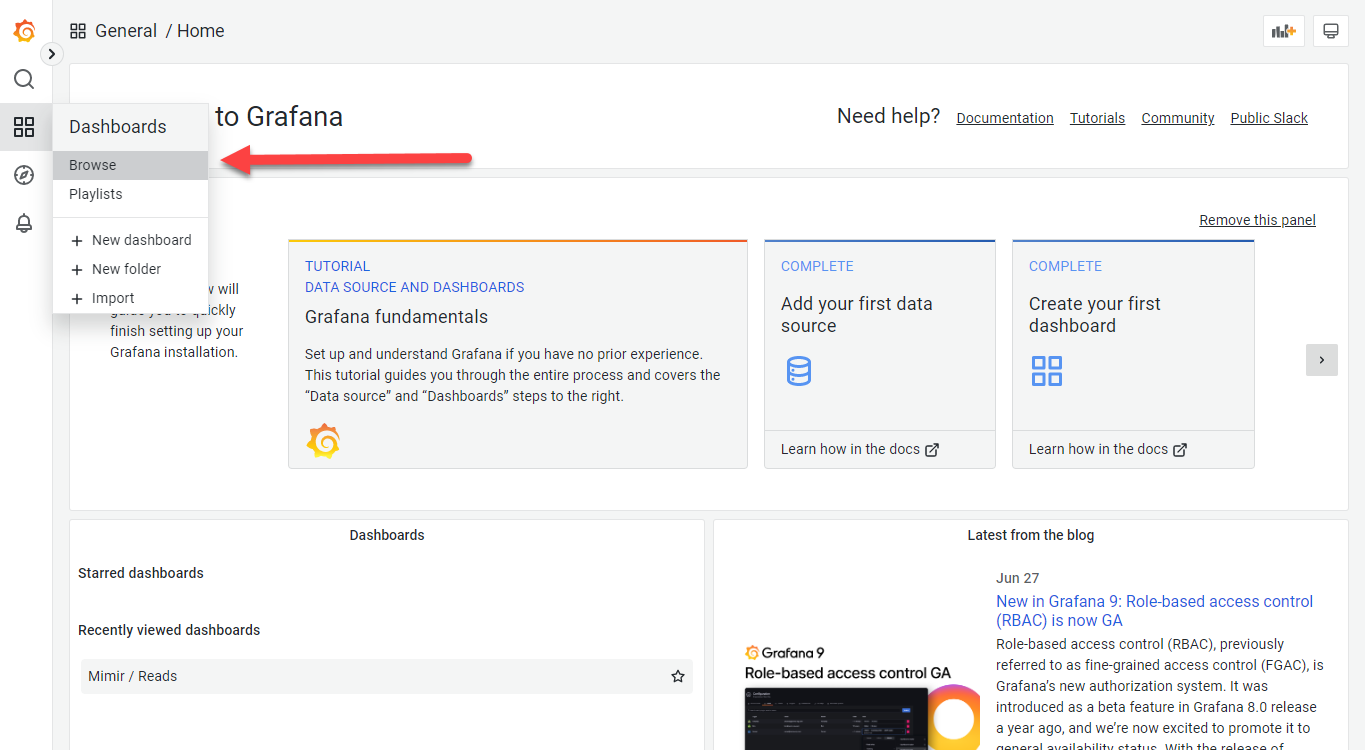
To access Grafana, launch a browser and open http://localhost:9000. You’ll use Grafana to view dashboards that display the status of the Mimir cluster. The dashboards query Mimir for the metrics they display. From the menu on the top left, click Dashboards, then Browse to see the dashboards that have been preloaded for the tutorial. These dashboards are from the Grafana Mimir mixin, which packages together Grafana Labs’ best practice dashboards, recording rules and alerts for monitoring Mimir.
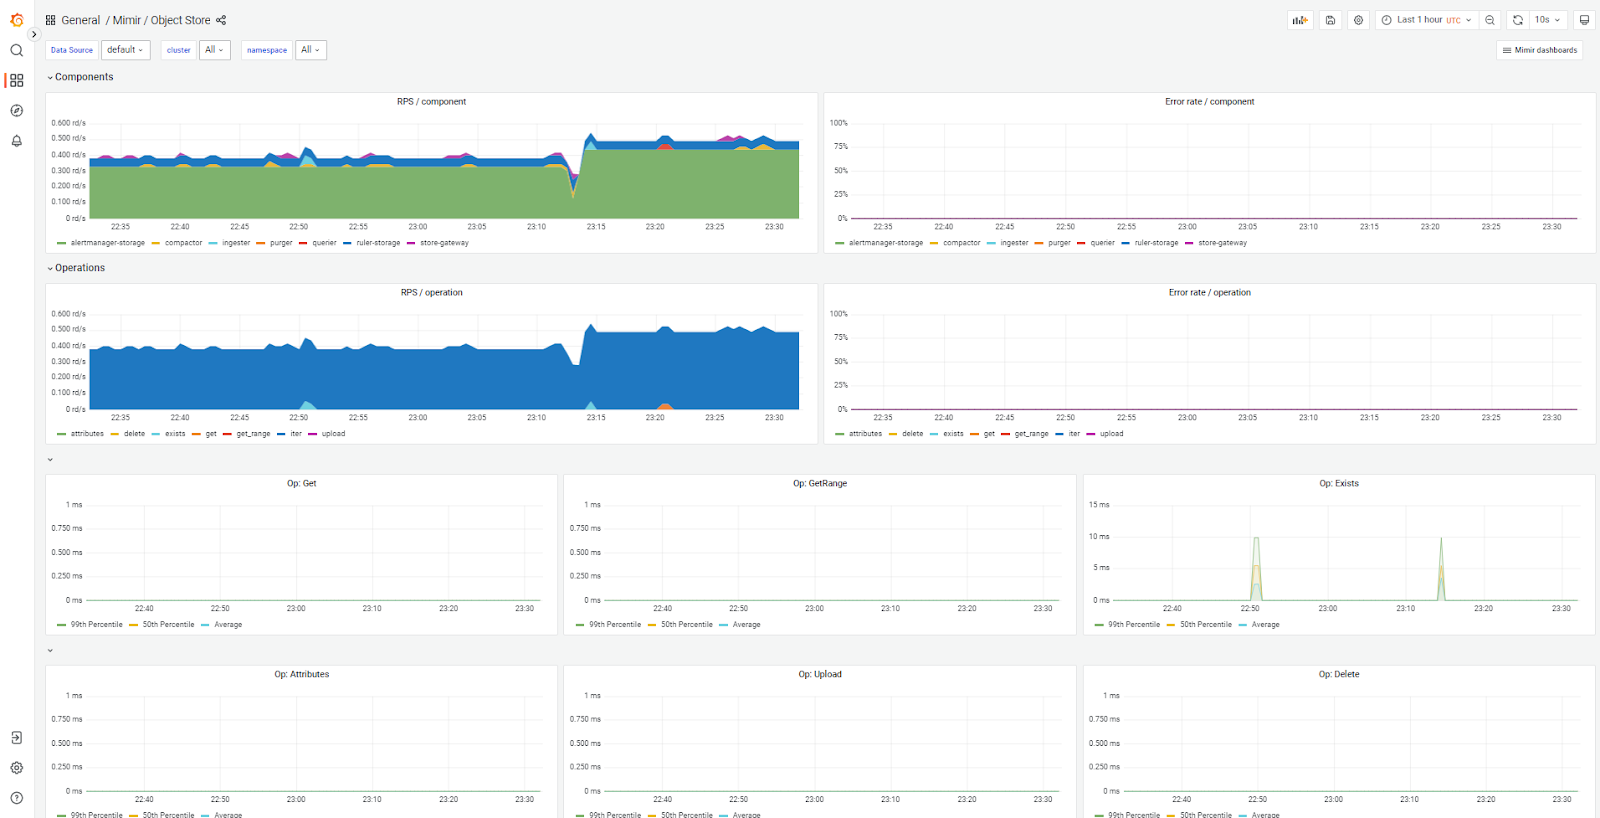
It typically takes 3-5 minutes after we launch our tutorial containers for metrics to be displayed in Grafana dashboards. We’re also running Mimir without an ingress gateway, query-scheduler or memcached, so the related dashboards will be empty.

At this early stage of learning Mimir, start by browsing the dashboards for writes, reads, queries and object store. For example, the object store dashboard shows operations that have taken place since we brought Mimir up.
Configure a Recording Rule
Recording rules are a mechanism that precomputes frequently needed or computationally costly expressions and saves the result as a new set of time series. Follow these instructions to configure a recording rule in Mimir using Grafana.
This sum:up recording rule will display the number of Mimir instances that are up and reachable to be scraped. Once the rule is created, it will be available for querying and inclusion in dashboards.
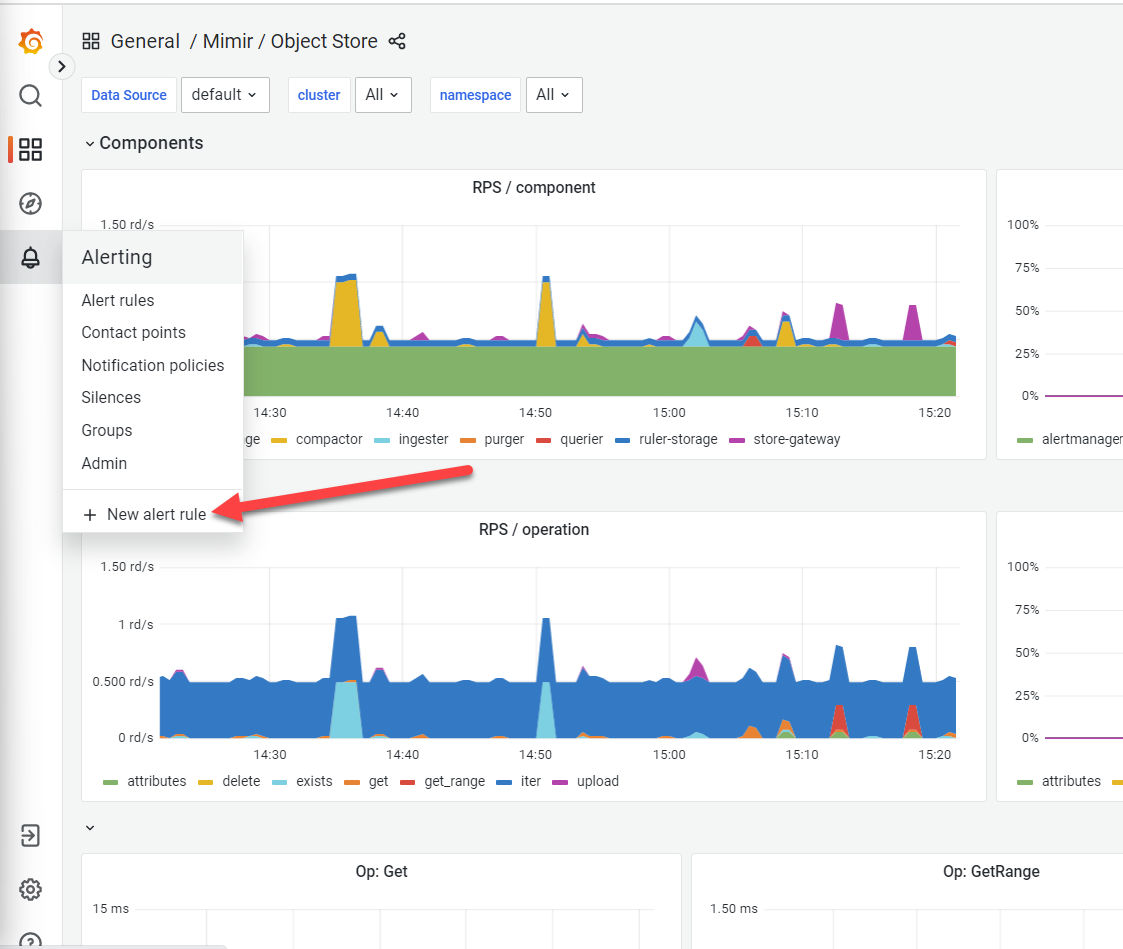
Open the Alerting menu from the left toolbar and click “New alert rule”:
Enter the following to configure the recording rule:
- Choose
Mimir or Loki recording rule - Configure the following:
- Rule name =
sum:up - Choose Mimir in the Select data source field
- Namespace =
example-namespace - Group =
example-group - Query Expression =
sum(up) - Choose Save and Exit in the upper right corner.
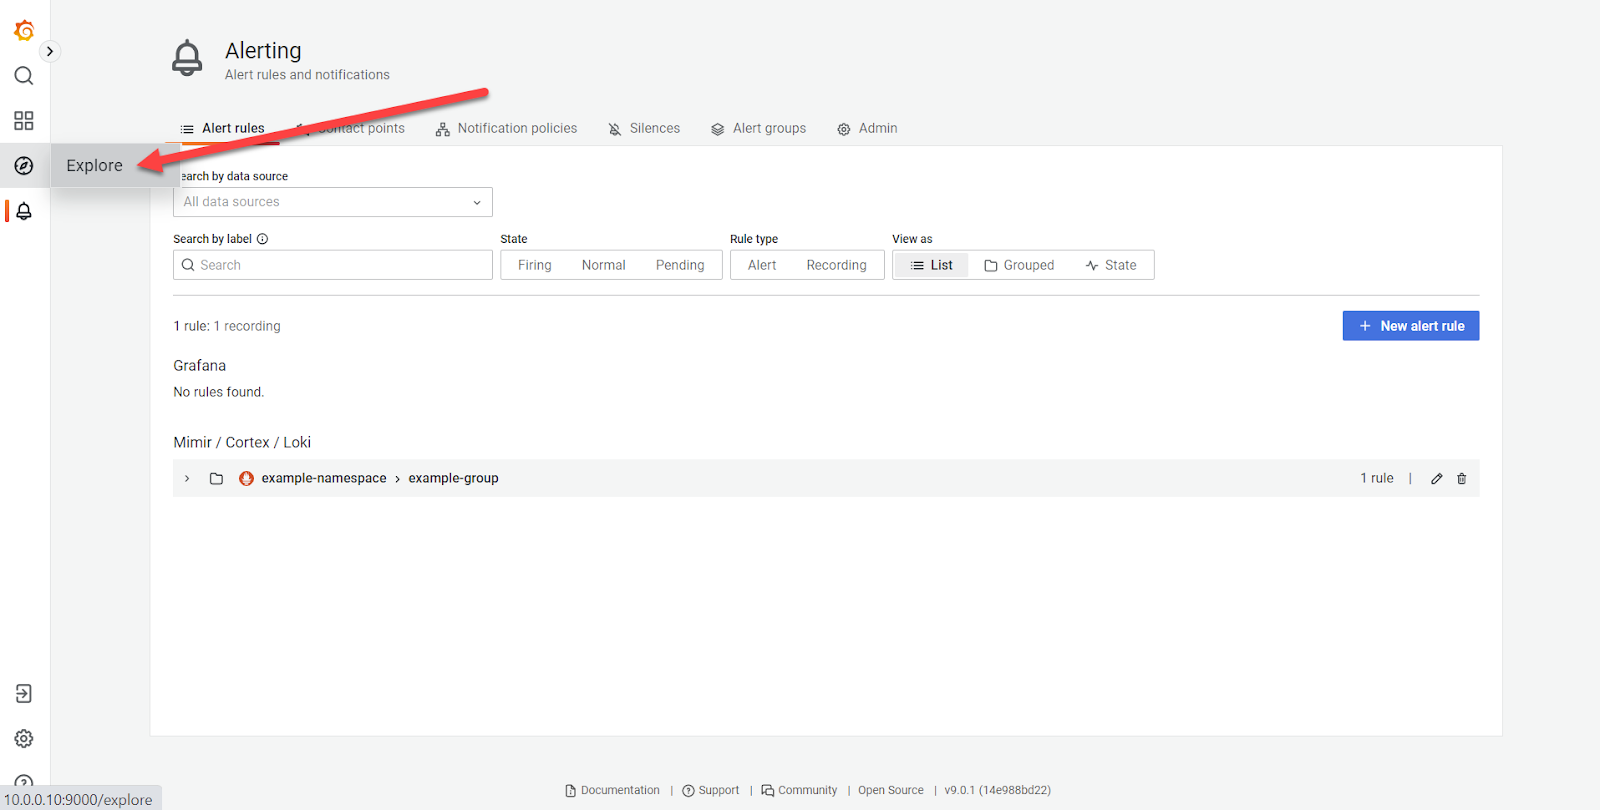
To verify that your new recording rule runs correctly, open Explore from the left hand menu:
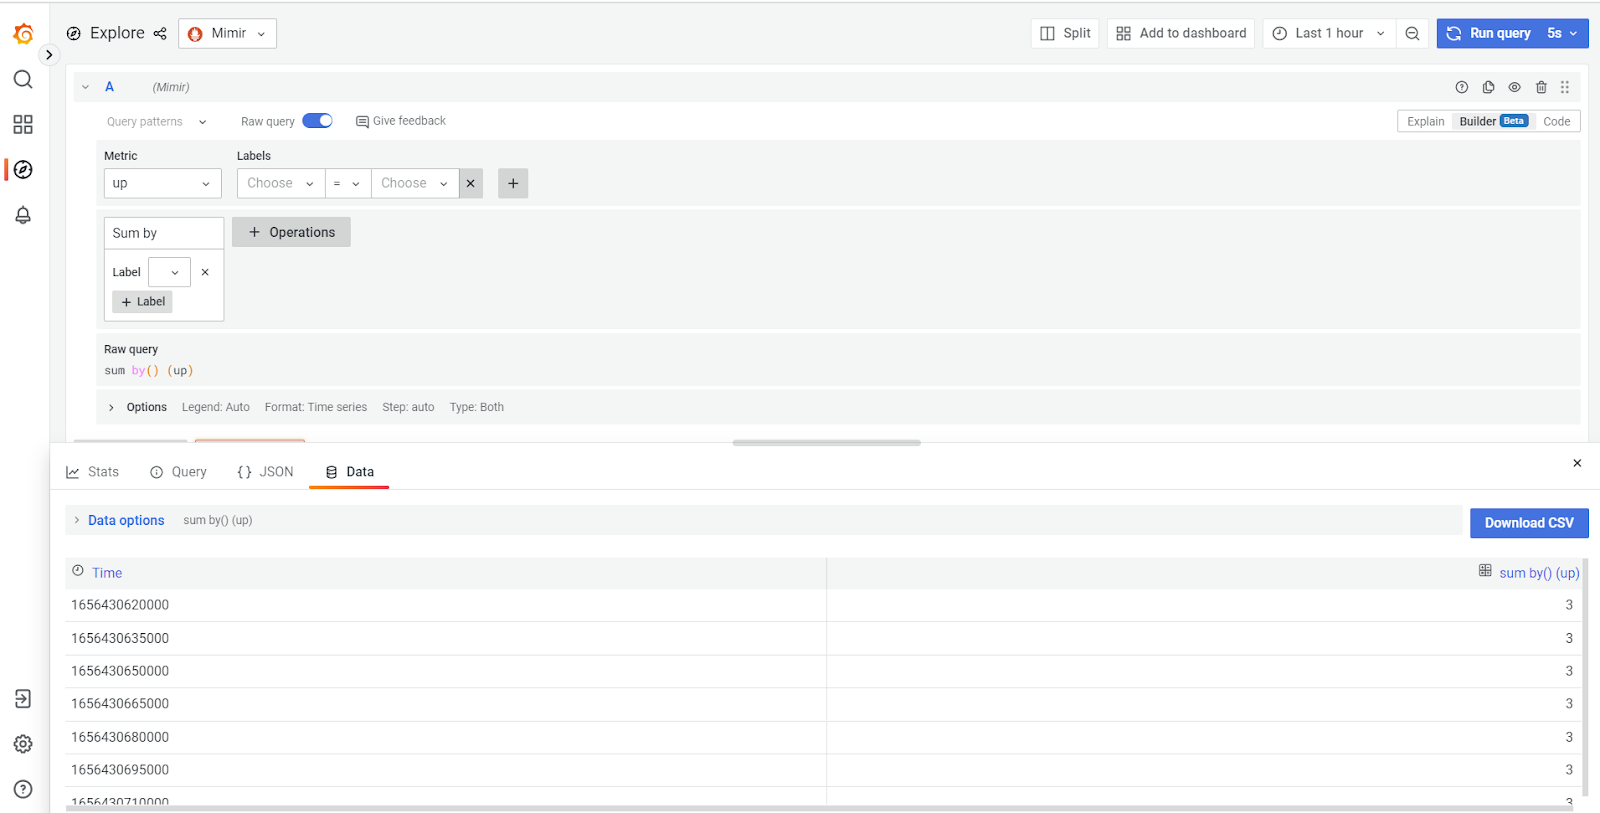
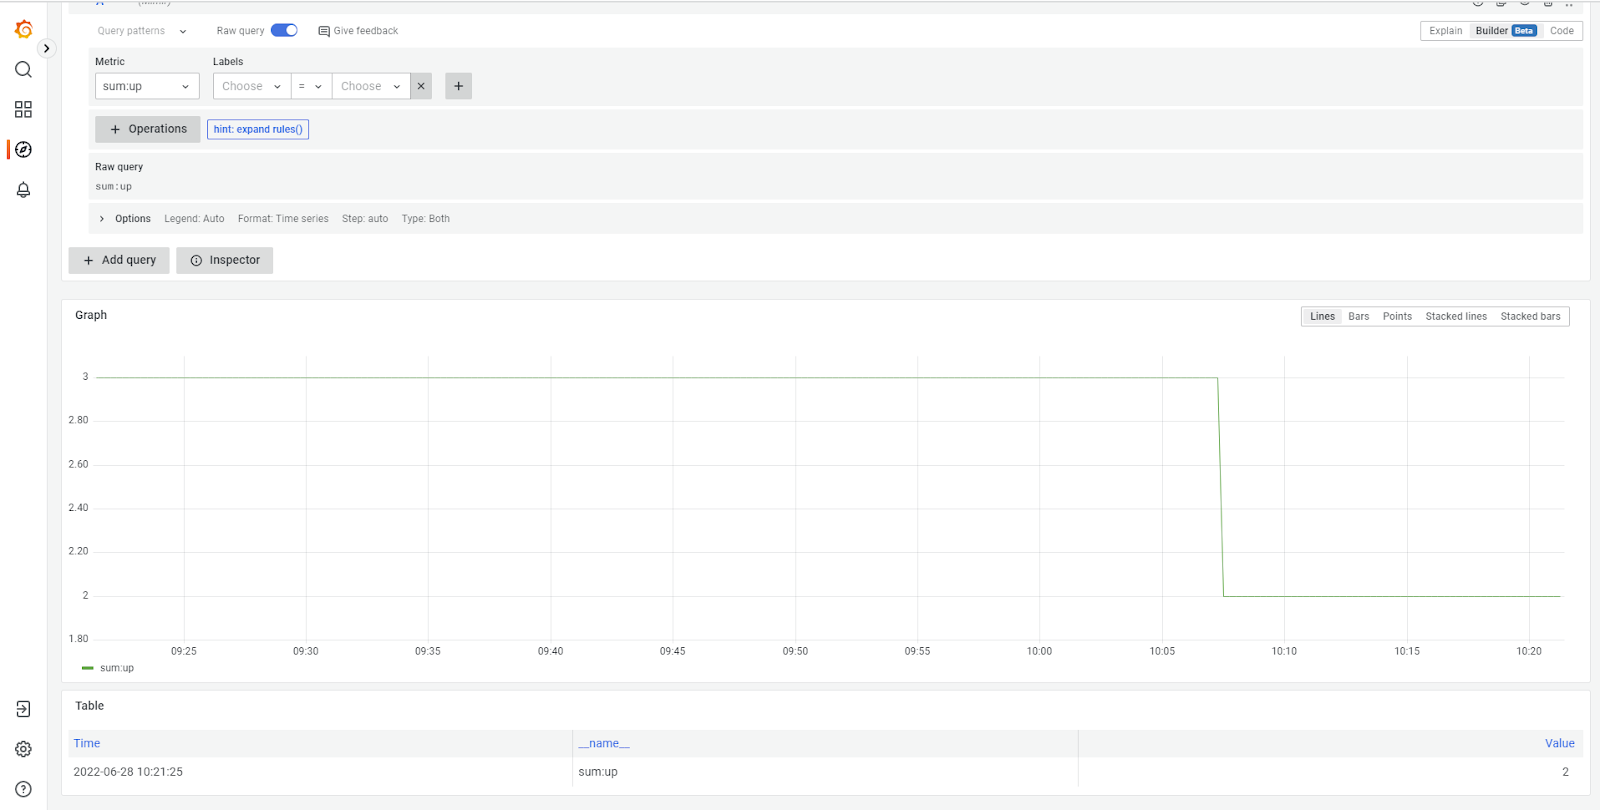
In the Metric dropdown, choose sum:up, then click Run query from the top right, then click on the Inspector button. Below, click Data to see a list of times and query results. The result should be “3”, indicating that the three local instances of Mimir are operational.
Configure an Alert Rule
Alerting rules built on Mimir follow the same PromQL format as those built on Prometheus and Loki. Grafana evaluates the expression and, if necessary, fires an alert using Alertmanager. We dug into this pretty deeply in an earlier blog post, Multi-Cloud Monitoring and Alerting with Prometheus and Grafana.
We’re going to create an alert that fires when the number of Mimir instances drops below three.
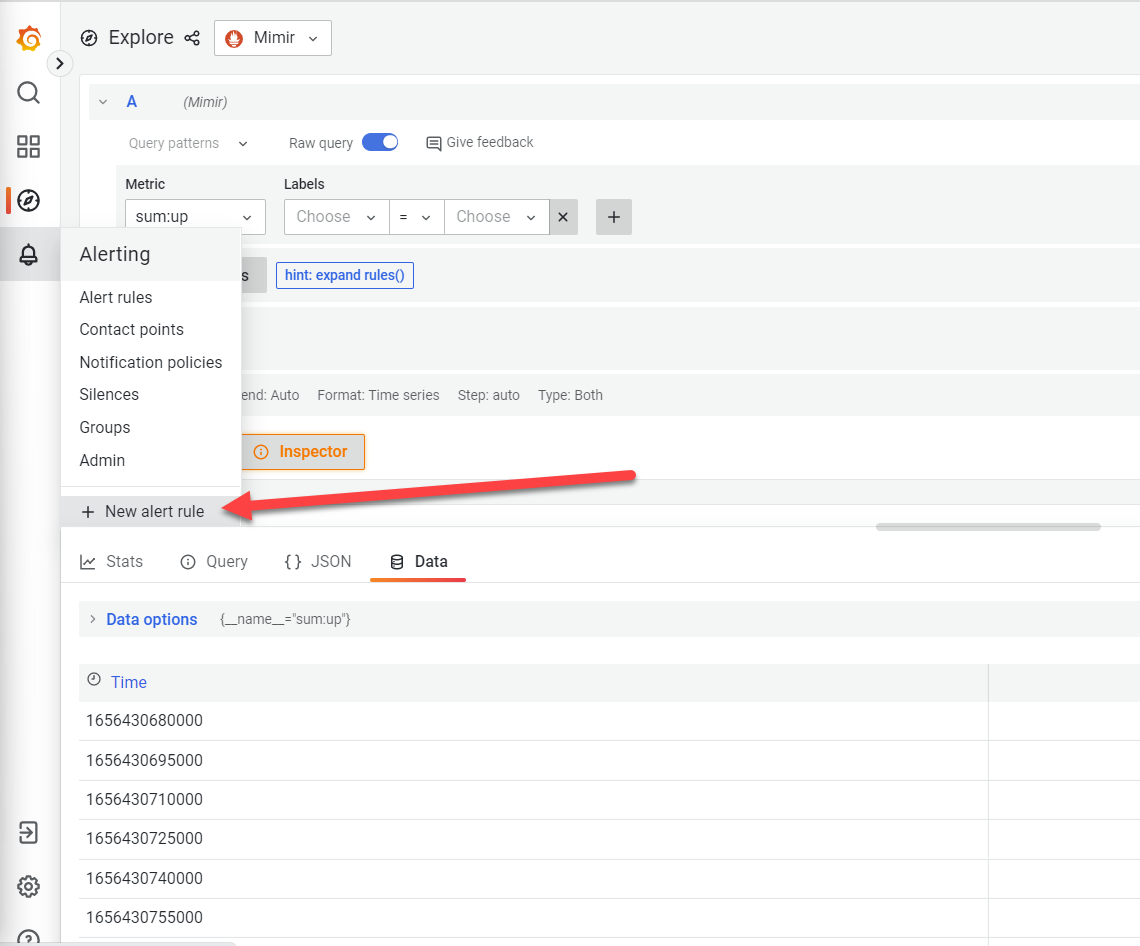
In the left hand menu, hover over Alerting and then click New alert rule.
- Choose
Mimir or Loki alert - Configure the following:
- Rule name =
MimirNotRunning - Choose
Mimirin the Select data source field - Namespace =
example-namespace - Group =
example-group - Query Expression =
up == 0 - Choose Save and Exit in the upper right corner.
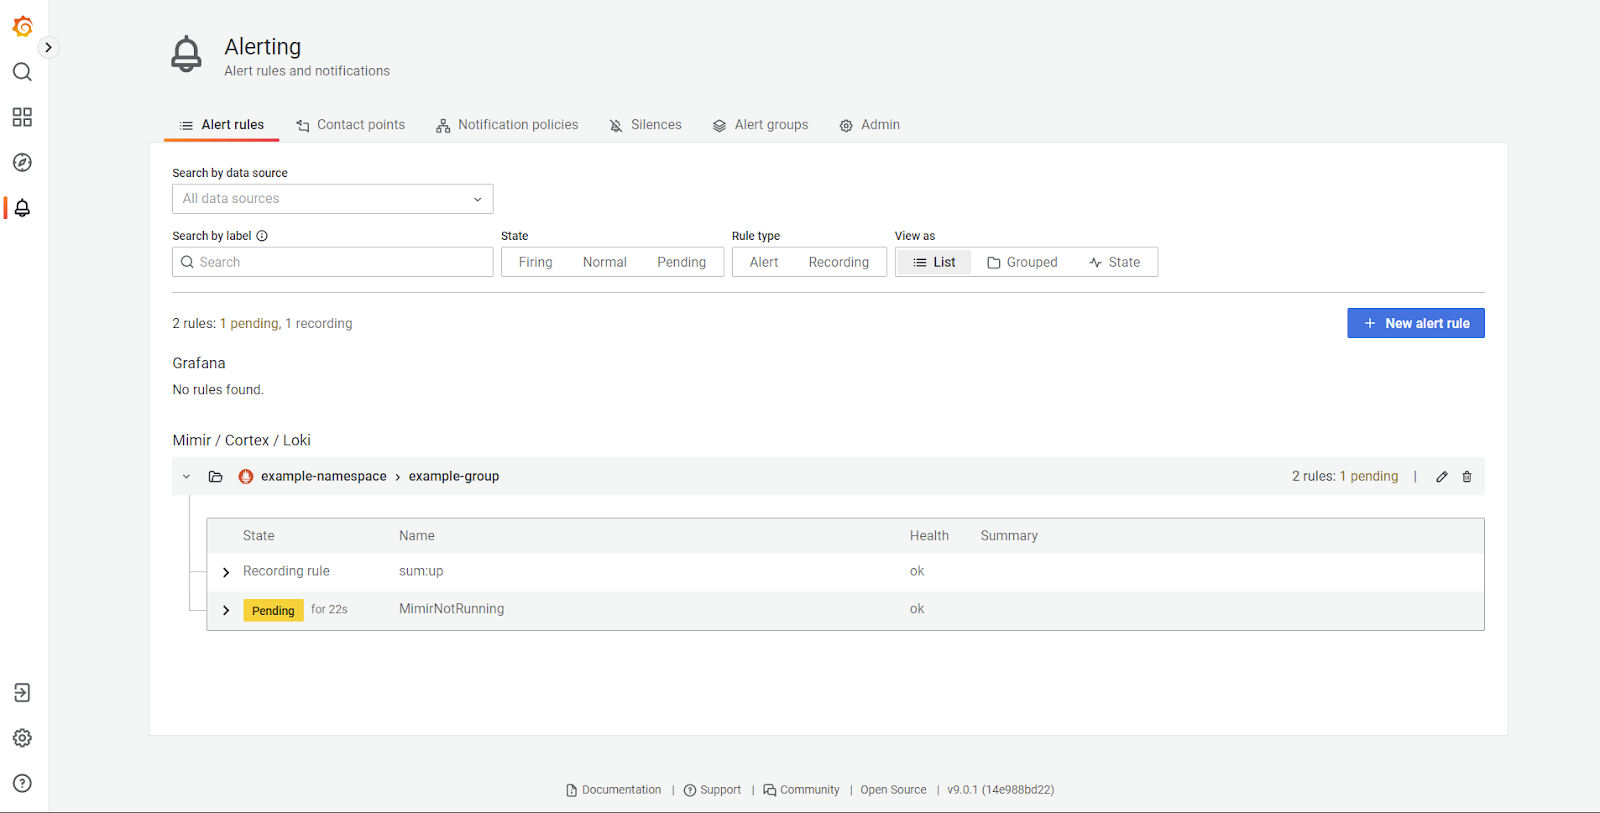
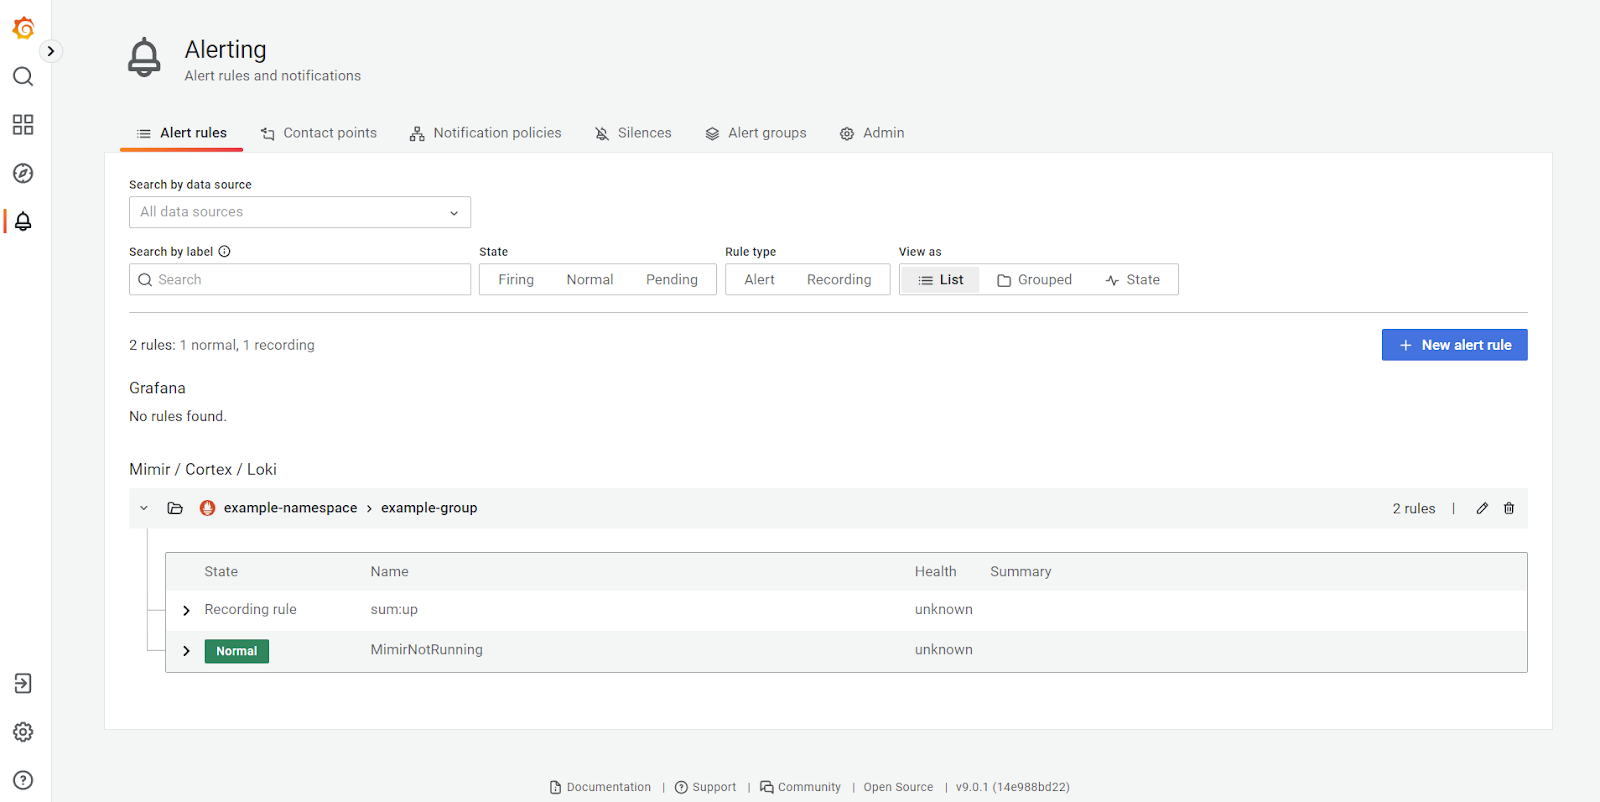
Navigate to the Alerting page and you will see our Mimir recording rule and alert rule. Note that there’s a nice, big, comforting green Normal status shown next to the alert because all of our Mimir containers are still running.

We’ll simulate an error condition by terminating one of the three Mimir instances (make sure that you are in the ~/mimir/docs/sources/tutorials/play-with-grafana-mimir directory :
As we abruptly terminated a Mimir instance, there will be a brief period where Grafana shows an error while querying rules. This will automatically resolve as soon as Mimir’s internal health checks detect the terminated instance as unhealthy.
In about one minute, the alert will shortly indicate a yellow Pending state.
After another minute, the alert will turn to the red Firing state:
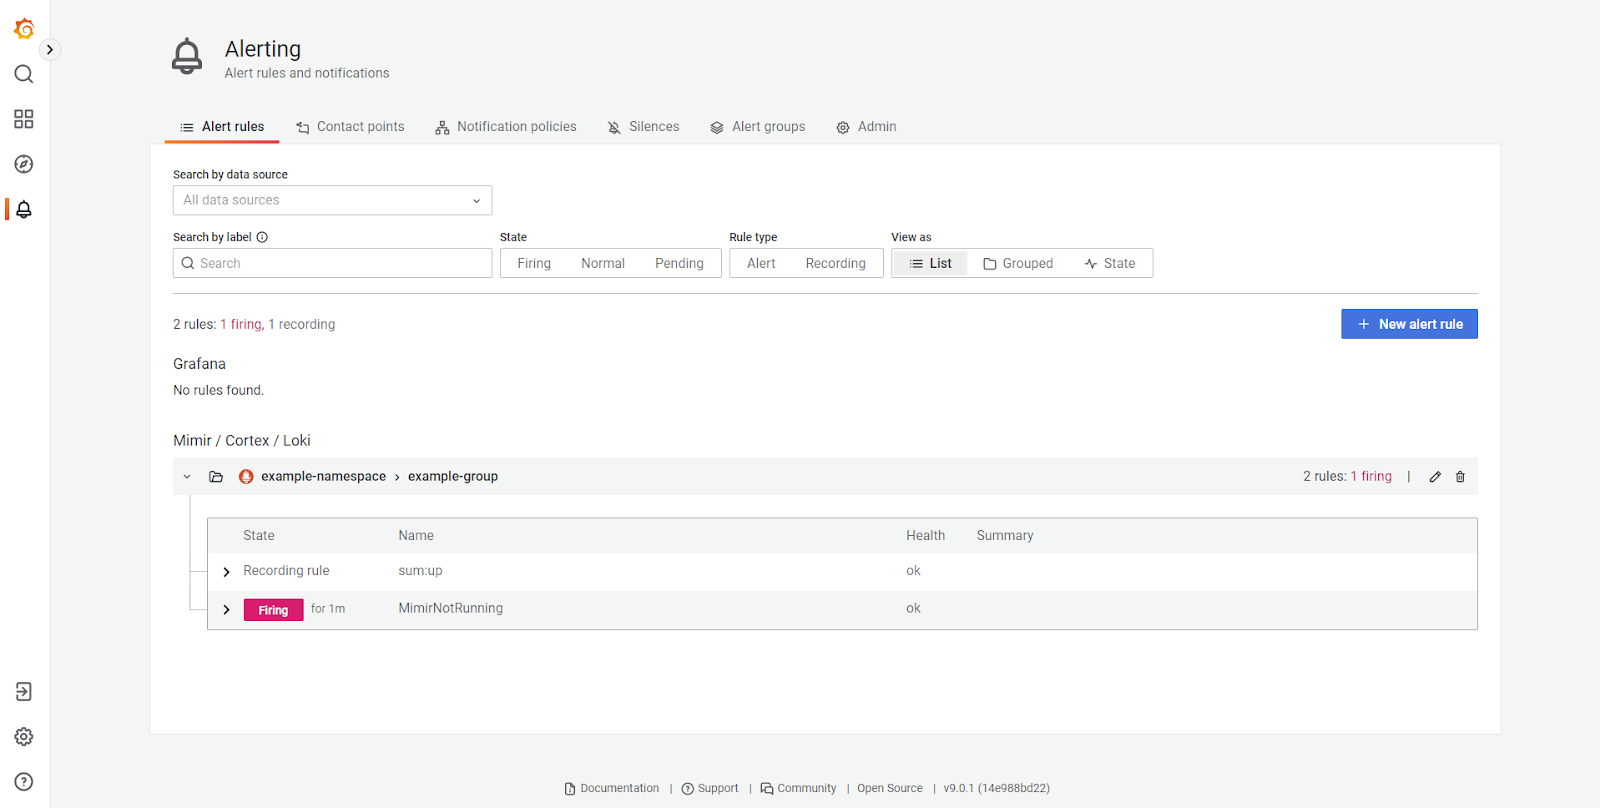
If we had configured Alertmanager with notification channels, alerts would be firing off to the appropriate mechanism and contact. Please see Multi-Cloud Monitoring and Alerting with Prometheus and Grafana for instructions.
Before we bring our terminated Mimir instance back up, return to the Explore page in Grafana and query our sum:up recording rule. We can see that Mimir continued to record metrics even though a Mimir instance was down.
Finally, bring the Mimir instance back up:
Return to the Alerting page and notice that our alert status is back to Normal.
Conclusion
In this tutorial, you learned how to run Grafana Mimir and MinIO in a high-availability configuration. We consumed Prometheus metrics from Mimir itself, then queried and visualized them in Grafana. We also configured a recording rule and an alert and verified that the alert fired as expected when the condition was met.
You can also configure Mimir and Grafana to scrape Prometheus metrics from MinIO and fire alerts via AlertManager. Mimir stores data in object storage for persistence, allowing it to take advantage of ubiquitous, cost-effective and high-durability MinIO.
Give Grafana Mimir a go! If you have questions, please join our Slack channel or send us an email at hello@min.io.


