Introducing SUBNET Health

SUBNET is the commercial engine of MinIO. It is how production instances of MinIO are consumed, from startups to the most valuable technology companies in the world.
SUBNET combines a commercial license (important for the AGPLv3 obligations) with a unique support model that delivers 24/7/365 direct-to-engineer support through a MinIO-built portal that blends the best of Slack and Zendesk into an issue-resolving machine. There are a number of other features including security and architecture reviews, access to the Panic Button and indemnification, but the core function is to transmit our expertise to our clients for large scale data infrastructure solutions.
SUBNET is so disruptive because of our obsession with simplicity. Simplicity in our software. Simplicity in our approach (we only do one thing, object storage). These conspire to create a product that is simple to support.
Also, automation. Lots of automation.
That is what this post is about. Automation.
Supportability as Software
Our latest feature in SUBNET is SUBNET Health and it is all about automating maintainability. SUBNET Health provides a graphical user interface to key supportability components while automatically running dozens of checks on your MinIO instance to ensure it is running optimally.

It starts with a simple command: mc admin subnet health TARGET
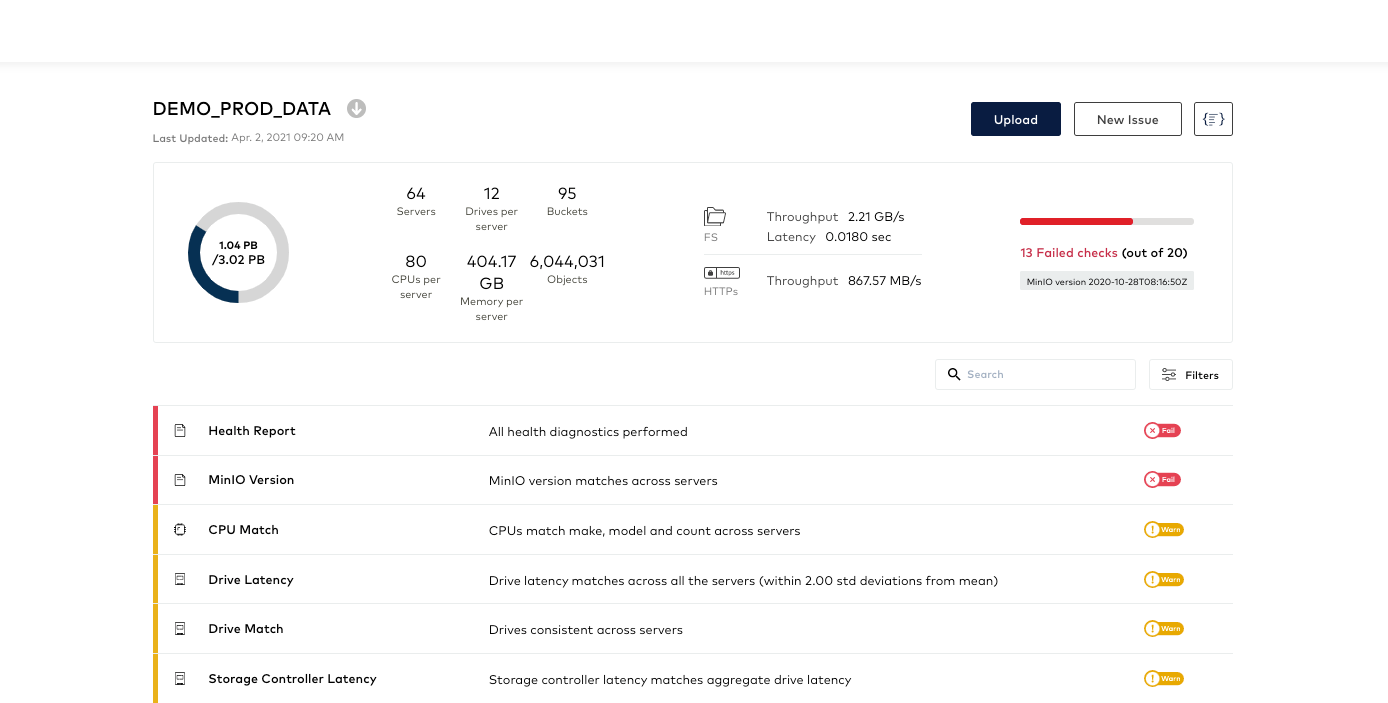
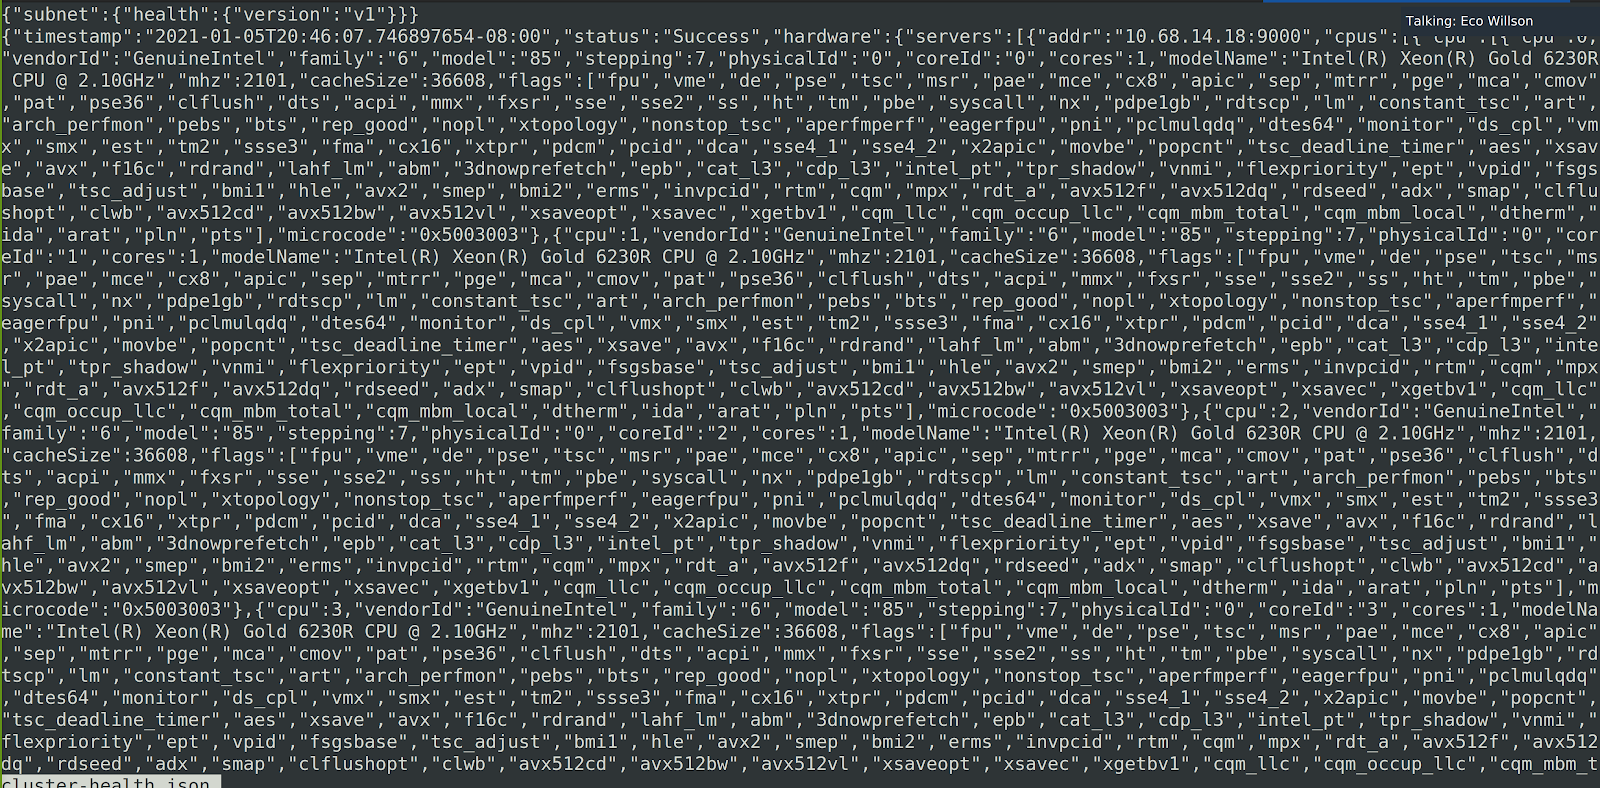
This in turn creates a JSON file from your instances (we will come back to this later when we talk about air gapped environments). You then upload this file to SUBNET and voila - you have what you see above.
Let’s talk about what we are looking at here and break it down into sections.
First off, this report is effectively a comparative analysis of the distributed system. SUBNET Health is cataloging every component from hardware to software to ensure consistency within any given pool and flagging those instances where there are discrepancies. Previously, this meant writing a script and running that script against every node. In and of itself, this automated function represents a huge time savings. The generated report can be broken down into three broad categories:
Hardware
In the hardware test, MinIO is looking for consistency within the Server Pools. In the MinIO architecture, a Server Pool is an independent set of nodes with their own compute, network and storage resources. Think of it in terms of a cluster in itself. There can and will be heterogeneity across the clusters/pools, but MinIO needs homogeneity within the pool. As a result, MinIO checks each pool for:
- CPU Flags
- CPU Match
- Drive Match
- Drive Usage
- Drive Throughput
- Storage Controller Throughput
- Memory Size
Let’s pick on Drive Match. This is important because if you have six 500GB drives and four 1TB drives in the same pool the 1TB drives will be underutilized. Knowing this will allow you to quickly reallocate those 1TB drives into its own pool thereby optimizing the overall instance.
Software
Software checks represent that delicate bridge between the things IT is inherently comfortable with (CPU, Network, Drives) and the things that Developers are inherently comfortable with (versions, configurations). The following Heath Checks fall into that category:
- MinIO Version
- Operating System Match
- File System Atime
- Server Process
- File System Match
- File System Supported
- Swap Memory
Let’s pick on File System Atime. Here is another area where experience has taught us to pay attention to, but rarely is it on the mind of our enterprise customers. This effectively ensures that, for performance reasons, you are not choosing to log every access to a file (an often overlooked tunable parameter for file system performance) but rather the elements that are important to the business.
Benchmarking
The benchmarking tests are not deep but are granular. They are designed to flag problems that are often overlooked but can be impactful. These are often manifested as bottlenecks that you simply don’t know that unless you have them in front of you - because again, no one is looking to check on that.
- Drive Latency
- Storage Controller Latency
- Network Link Latency
- Network Link Throughput
- Network Switch Throughput
While we just covered the checks, it is also worthwhile to spend a moment on the dashboard. Within SUBNET Health you can easily see the key elements across all of your instances:

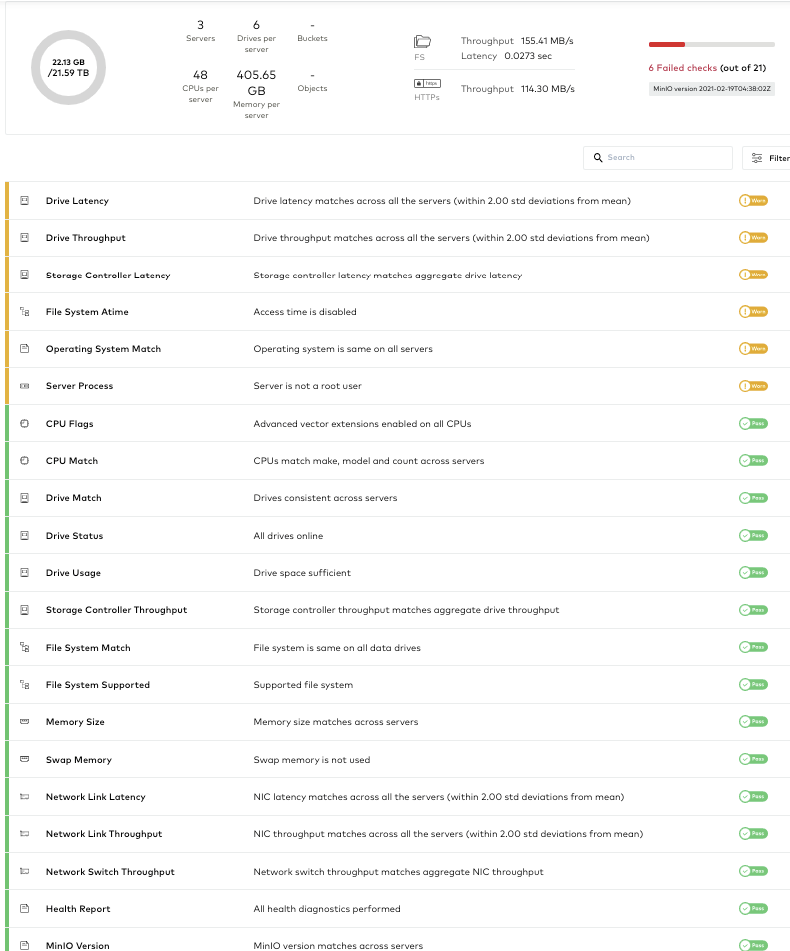
Further you can drill into any single instance to see slightly more detail:

The detailed version provides the full view into the profile of that instance including:
- Utilization
- Number of Servers
- Number of Drives per Server
- CPUs per Server
- Memory per Server
- Buckets
- Objects
- File System Throughput and Latency
- HTTPs Throughput
Having this at your fingertips is a massive time saver for admins and developers alike.
Air Gapped Environments
One slick thing about SUBNET Health is that it is both optional and perfect for air-gapped environments. Many production instances, not just those in the defense and intelligence community are not connected to the network. This makes sense for a variety of reasons and SUBNET Health accommodates those by having the creation of the JSON file separate from the diagnostic process. This way the file is created about the system without interacting with the data on the system. That file can then be uploaded to SUBNET independently. No connectivity required to get full diagnostics.
So what.
So why does this matter to our users and why is it important now? The answer lies in MinIO’s commercial acceleration over the past year plus. In that time we have seen our enterprise adoption skyrocket. We are in more than 60% of the Fortune 500. Almost every major financial institution is running MinIO in some capacity from ABSA to Ziraat Banksai.
With that adoption comes a much wider audience for MinIO with much higher stakes. While MinIO’s simplicity, cloud-nativeness and performance have driven much of that adoption, we needed to take our maintainability to another level.
SUBNET Health lets our customers and us get to the root cause orders of magnitude faster than we would otherwise. It is comprehensive. It is automated and it is deeply descriptive (there is an advanced feature section that is beyond the scope of this post).
The “so what” is that when we encounter issues (see our Tech Field Day preso for stats on that) we solve them quickly. Not days quickly. Minutes quickly.
You can get at this data in the command line - but the utility and speed of this approach is, well, challenged.

We encourage you to check out this short tour of SUBNET. If you have any questions, hit us up on our Ask the Expert chat, it is staffed with real people and real smart people at that.


