Spelunk through your AI data infrastructure with Splunk

Overview
MinIO AIStor and Splunk have a symbiotic relationship when it comes to enterprise data. Splunk uses MinIO in its Digital Stream Processor. MinIO is a Splunk SmartStore endpoint.
AIStor is a high performance, Amazon S3 compatible, distributed object storage system. By following the methods and design philosophy of hyperscale computing providers, AIStor delivers high performance and scalability to a wide variety of workloads in the private cloud. Because AIStor is purpose-built to serve only objects, a single-layer architecture achieves all of the necessary functionality without compromise. The advantage of this design is an object server that is simultaneously performant and lightweight.
In this post we explain how to use Splunk's advanced log analytics to help understand the performance of AIStor and the data under management. The commercial version of MinIO has caching capabilities that can greatly speed up data access which will help you retrieve frequently accessed data quickly. Check out The Real Reasons Why AI is Built on Object Storage where we dive into how and why MinIO is used in the AI/ML ecosystem.
AIStor Notification 101
AIStor allows administrators to configure various types of notifications, including audit logs (which gives details about any API activity that happens within the cluster such as creating new buckets, adding or deleting objects, listBucket calls, etc...) and AIStor server logs, which give details about errors that happen on the server.
At AIStor, we believe that simplicity scales, and this philosophy extends to our logging. We only log critical errors. Information and warn level logging only flood the logs with white noise that is rarely, if ever helpful. Given this approach, we know if we see an error in AIStor, it is something that needs to be addressed.
Splunk can help us understand and optimize AIStor's performance. Using Splunk's powerful log analysis tools, we have insight into what is happening within our AIStor cluster, and what is happening to the data that lives there.
Setting up the Splunk HTTP Event Collector
Splunk allows the collection of events directly to an http(s) endpoint, which they refer to as HEC, the HTTP event collector (documented here)
This requires a few simple steps. Configure the HEC global settings, create a token, and configure the index you want the data to reside in.
From the Splunk Web UI, go to Settings -> Data inputs -> HTTP event collector
Under global settings set All Tokens to "Enabled" and change default source type to _json
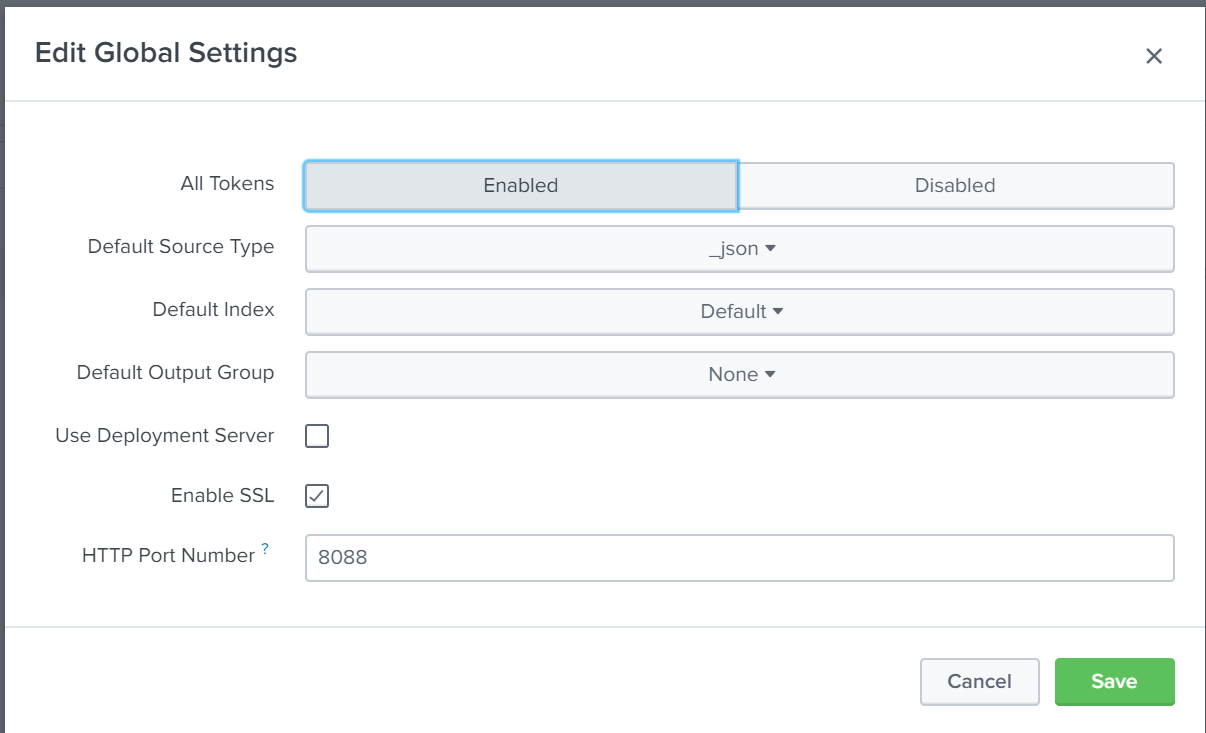
Other settings can be left at default. Since this is a test environment without TLS enabled, we will uncheck the "enable SSL" box before saving and continuing.
After this is complete, click "New Token" and follow the wizard.

On the next page of the wizard, "Input settings", click "Create new index"
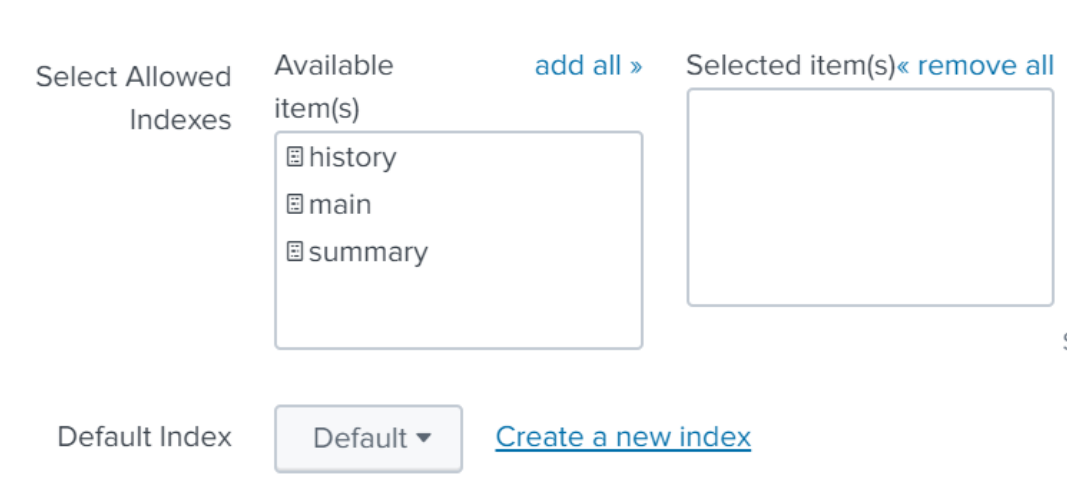
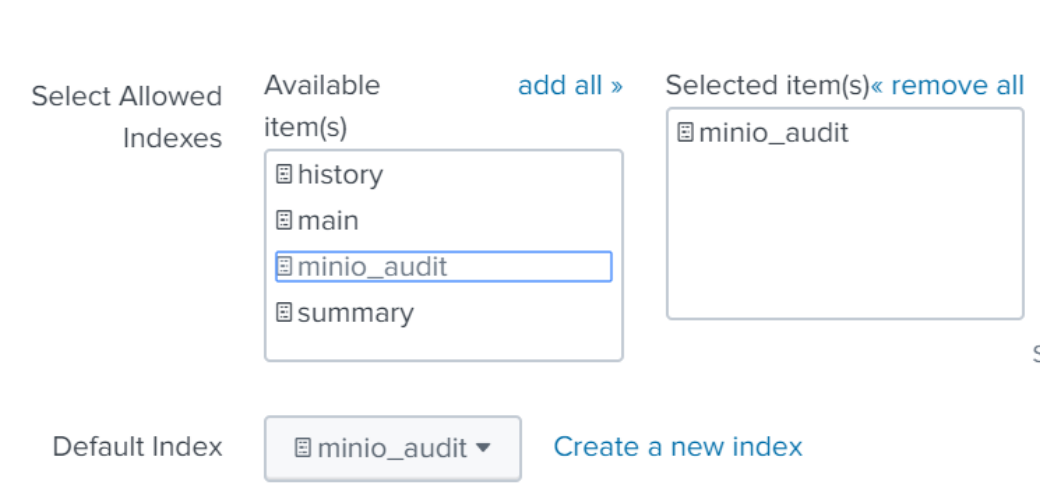
For the name, choose a name like minio_audit.
Change default index to the index you just named, and make sure it appears in the “Selected items” box on the right hand side to make sure your events go to the newly created index.
Click Review and Submit
You will see the newly created token
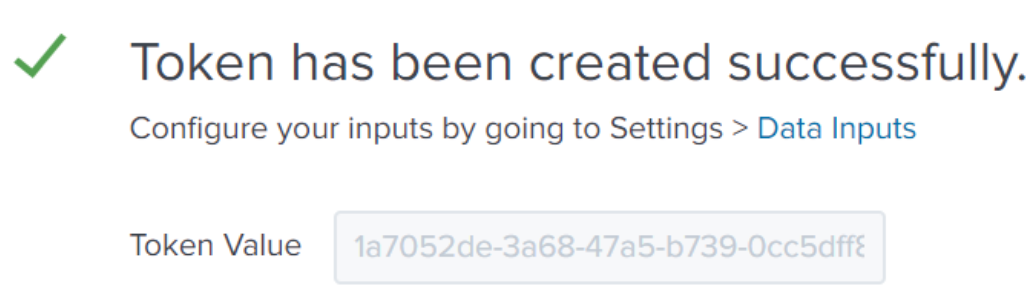
Copy this value to use in the next step.You can see this token later by going to Settings -> Data Inputs -> HEC
Splunk configuration is now complete. We can test and make sure things are working using curl before we move on to the AIStor side of things.
curl http://localhost:8088/services/collector/raw -H "Authorization: Splunk 2d30fe74-f448-4fc4-9522-6679e5377658" -d '{"event": "hello world"}'
{"text":"Success","code":0}
Note the “Success” status at the end. Now we can see the event by searching for index="minio_audit".
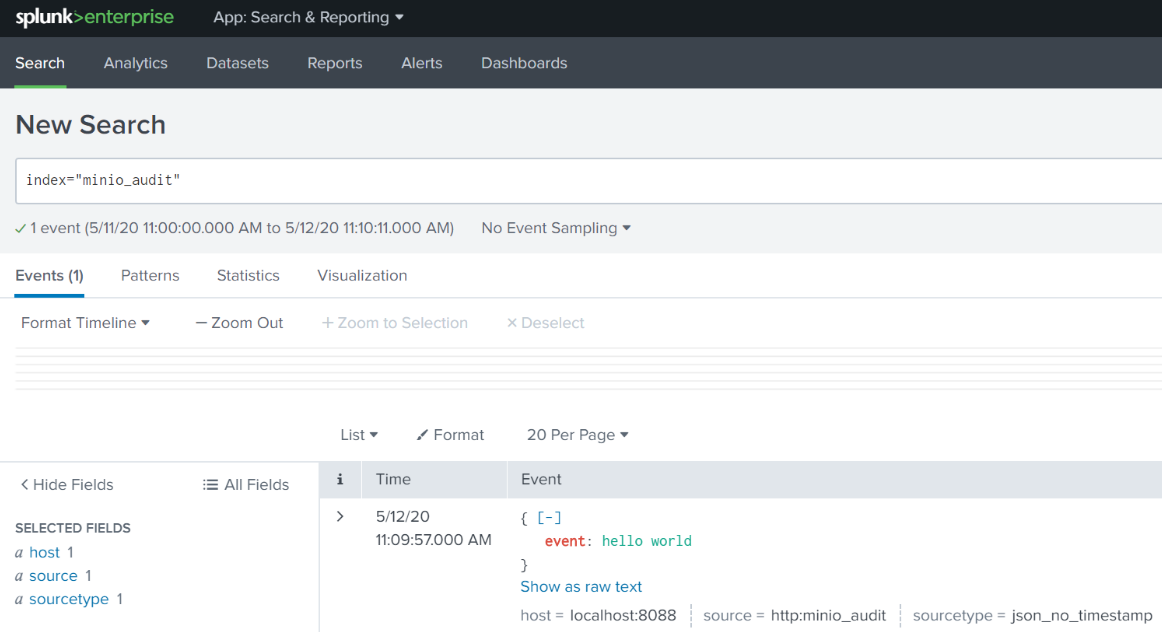
Now we know that we are using the correct token, and sending data to the correct index.
Configuring AIStor Audit Notifications
After verifying that the HEC endpoint is properly configured, we can use mc to take a look at the existing configuration for our audit notifications.
First, let’s take a look at all the possible configurations using mc.
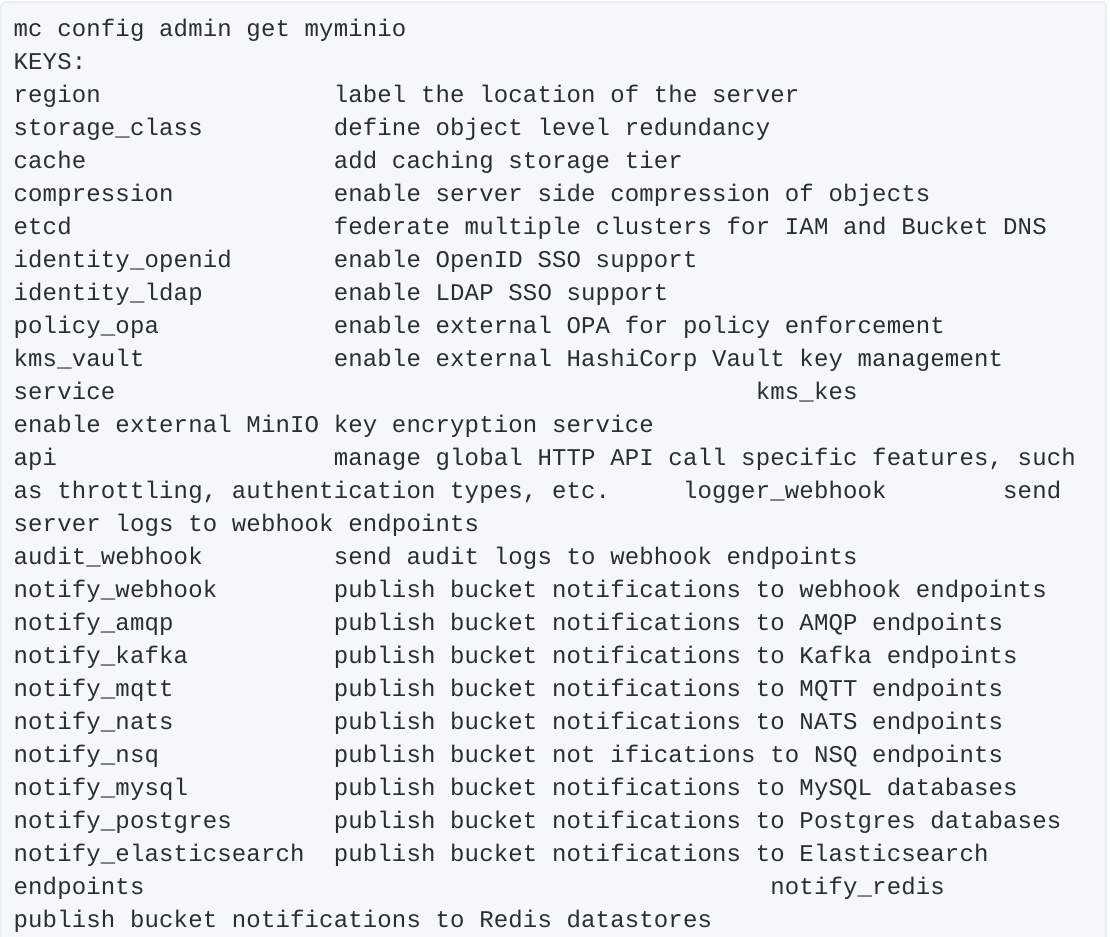
There are a lot of configuration options, but for now we are just concerned with audit_webhook. We will use this to tell AIStor to send its events to Splunk.
First, let’s take a look at what is already configured:
Here we see audit_webhook is not enabled, and doesn’t have an endpoint or auth_token defined. Let’s do that now using the values we got from Splunk.
As the message states, we need to restart the AIStor cluster, which can be done via the mc tool. When the server comes back up, we can verify the settings took hold.
Everything looks correct so far. First, let’s take a look at the buckets we have in our setup. If you don’t have a bucket configured yet, you can create one with mc mb myminio/mybucket. Here, we have a simple test setup:
Just a single bucket called “testevents”
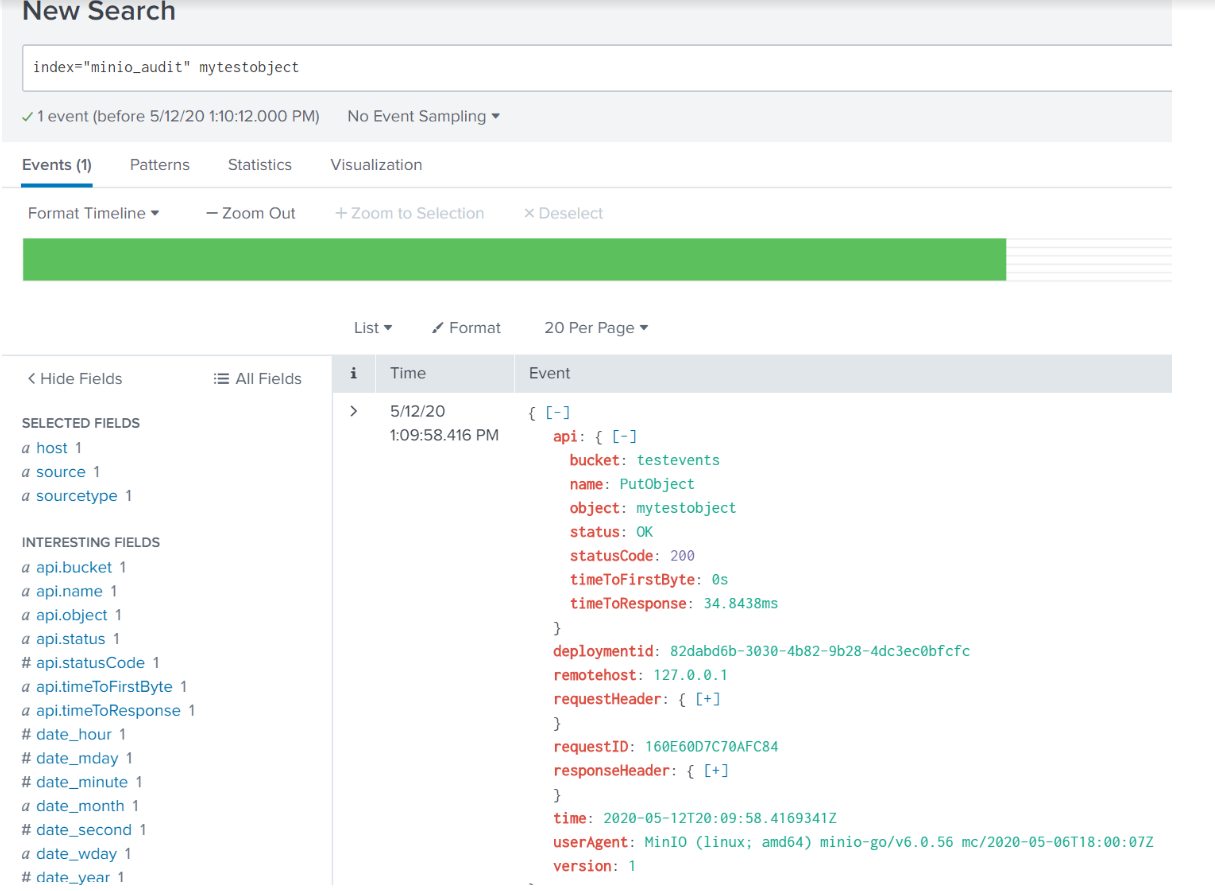
Now, let’s upload an object to that bucket
Going back to the Splunk search interface and searching for this object shows us the audit notification:
As with any audit logging, things can get pretty chatty. We can filter out a lot of that noise with a search that strips out all the typical day to day stuff by using this search in the Splunk Web UI:
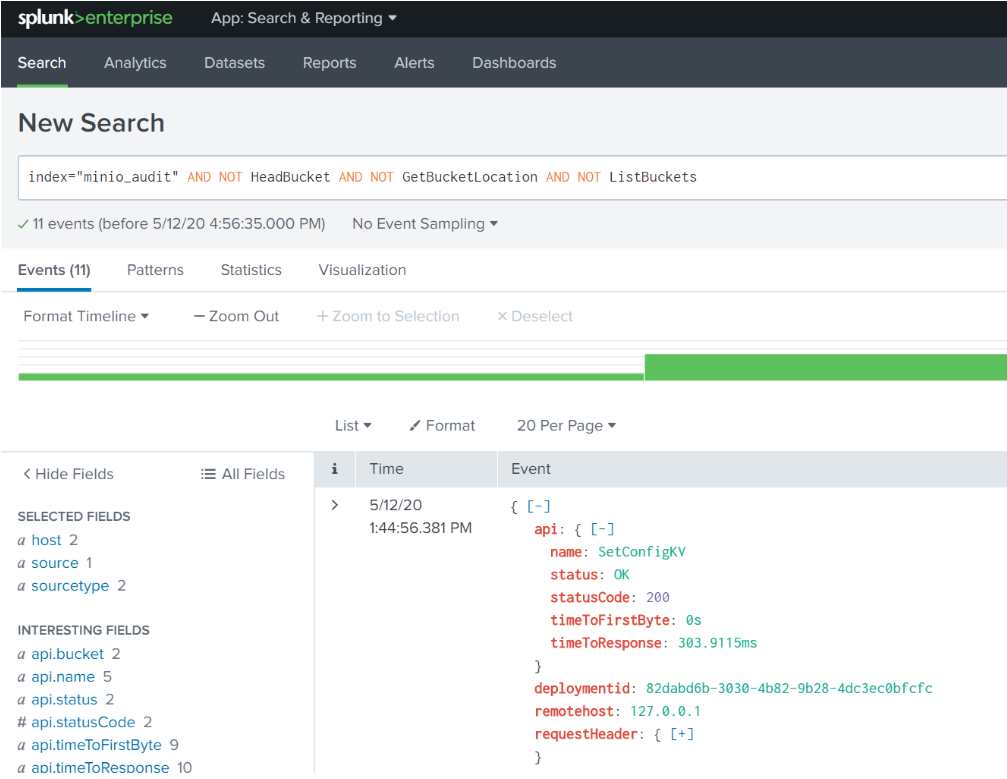
Now we have filtered out all day to day operations an admin might have been doing, like listing buckets. This will now show us the things we might care most about, like objects or buckets being created or deleted. Let's investigate the logs a little further.
Take this example, seen when I use the search term index="minio_audit" AND statuscode NOT 200:
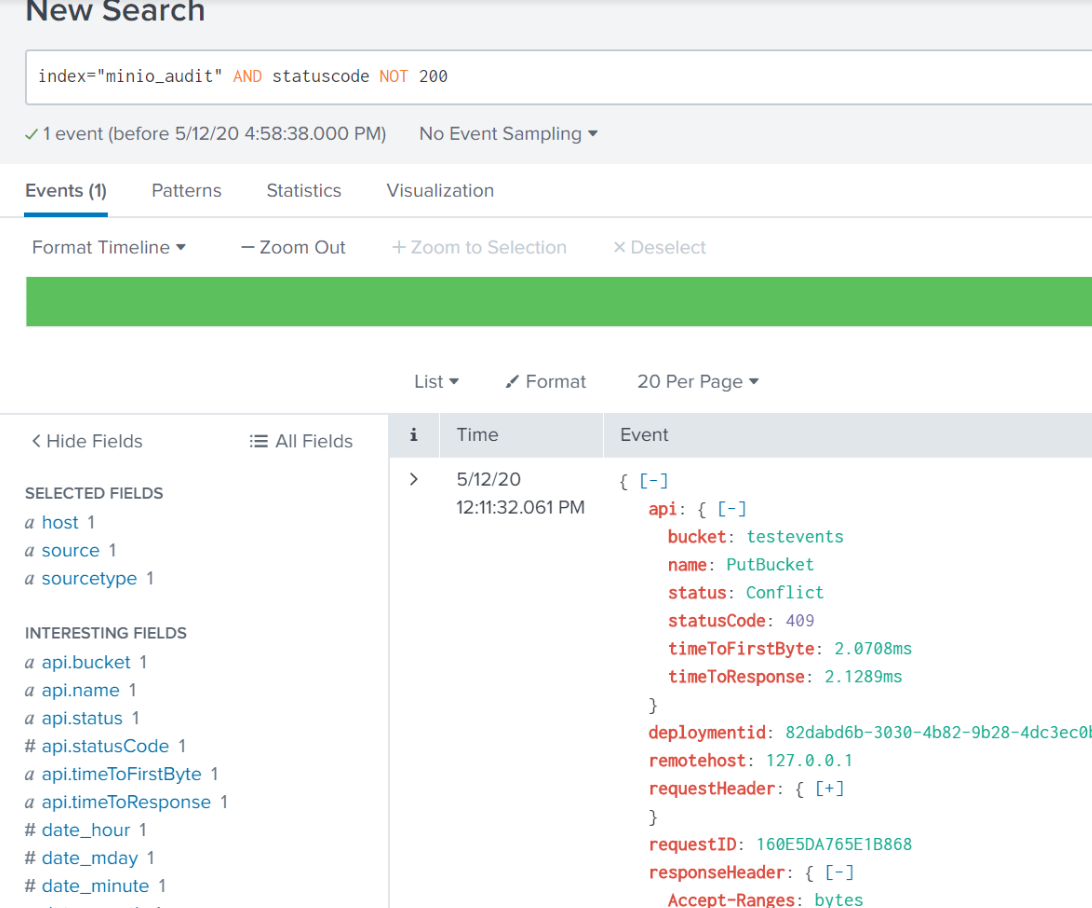
This is an event that is just a little bit different than a typical PutBucket. From the api: name field of this event, we know that someone was trying to create a new bucket. When we look at the status, we see Conflict and statusCode: 409. This means that someone tried to create a bucket, but it already existed. Maybe somebody accidentally reran a script or command to try and create that bucket. Not necessarily a big deal on its own. But if I see thousands of these in a day, I probably have some inefficient code running somewhere, and I can use this information to investigate further.
Some other interesting fields we can drill down on.
deploymentid - If I am running multiple AIStor clusters, I can use this to drill down onto a specific cluster
Server - Find the version of the AIStor server running for the request.
TTFB/TTFR - Can be used to find when a request is taking longer than expected.
Take note that even the response headers are logged, so you can tell for example whether custom metadata you attached to the object is present.
Configuring AIStor Logger Notifications
Knowing what users and applications are doing in your cluster is important. But, what about knowing what is happening to the cluster itself? For this, we can configure Splunk as an endpoint for the AIStor logger_webhook. If you remember from our previous mc admin config get myminio output, there was also a field called logger_webhook, that sends AIStor server logs to an endpoint. First, we take a look at what is configured:
Now, we set the configuration the same as we did with audit_webhook. Although you can use the same HEC token and index, you might want to separate them out by creating a new HEC token and index to put the data into. I prefer this approach, so you will notice that the token changes but the rest of the command remains the same. Since I created a new index, searches for these log events will be against index="minio_logs".
Don’t forget to restart afterwards for the configuration to take effect.
Remember from before, AIStor doesn’t log anything that doesn’t need action, so we will need to try and create some sort of failure in order to see something happen. To begin with, let’s take a look at how we are running the server for this testing. The command I used to start the server is as follows:
minio server /tmp/splunk/{1...4}
This simulates having a multi disk setup for the server, which means erasure code and bitrot protection are turned on. By default, AIStor erasure coding can handle n/2 disks being lost and still have read access to the data.
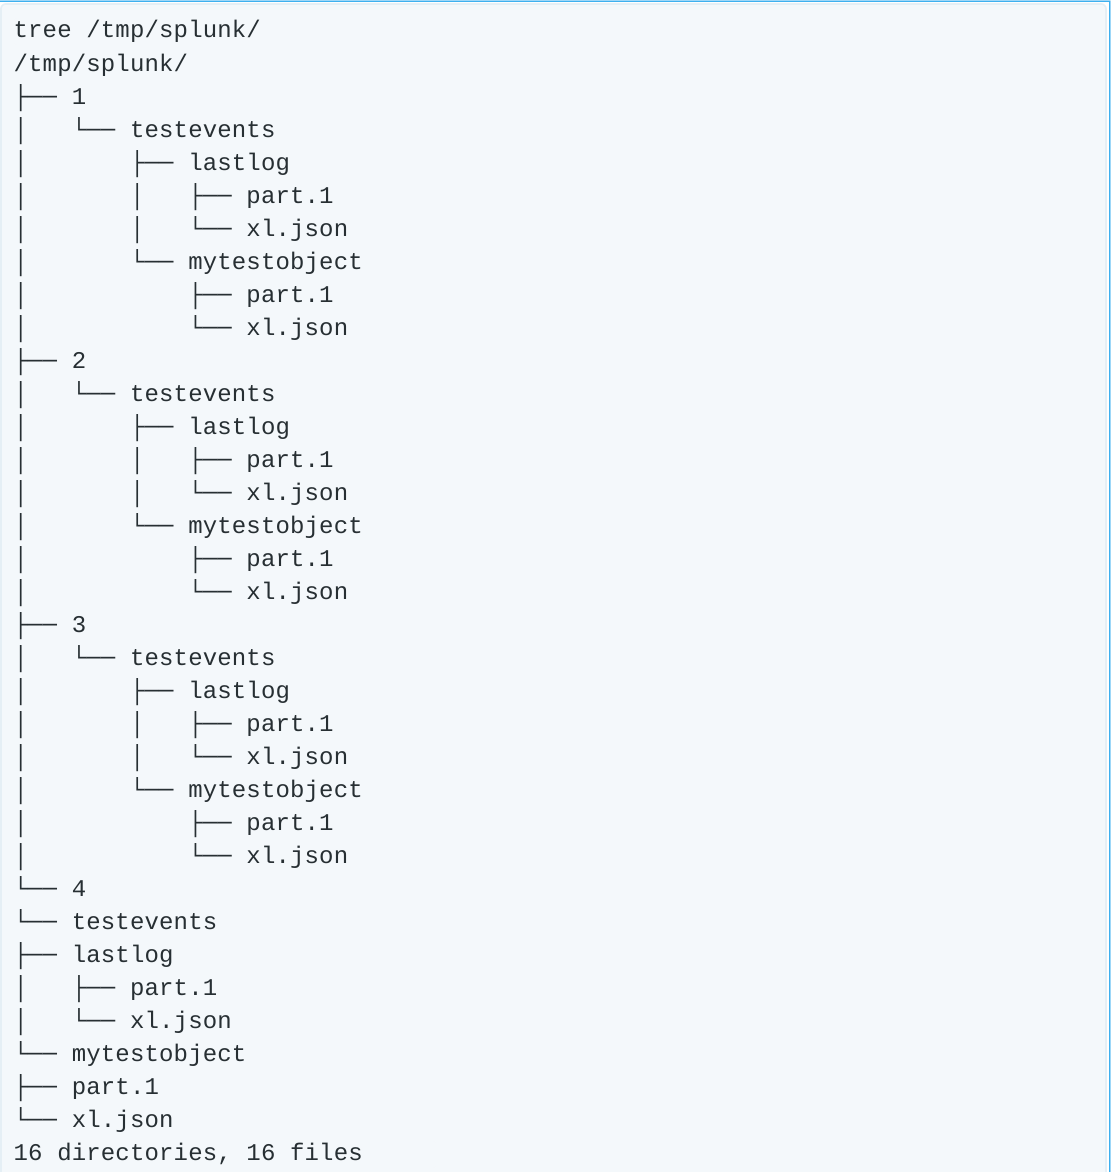
If we take a look at the backend filesystem, we see something like this:
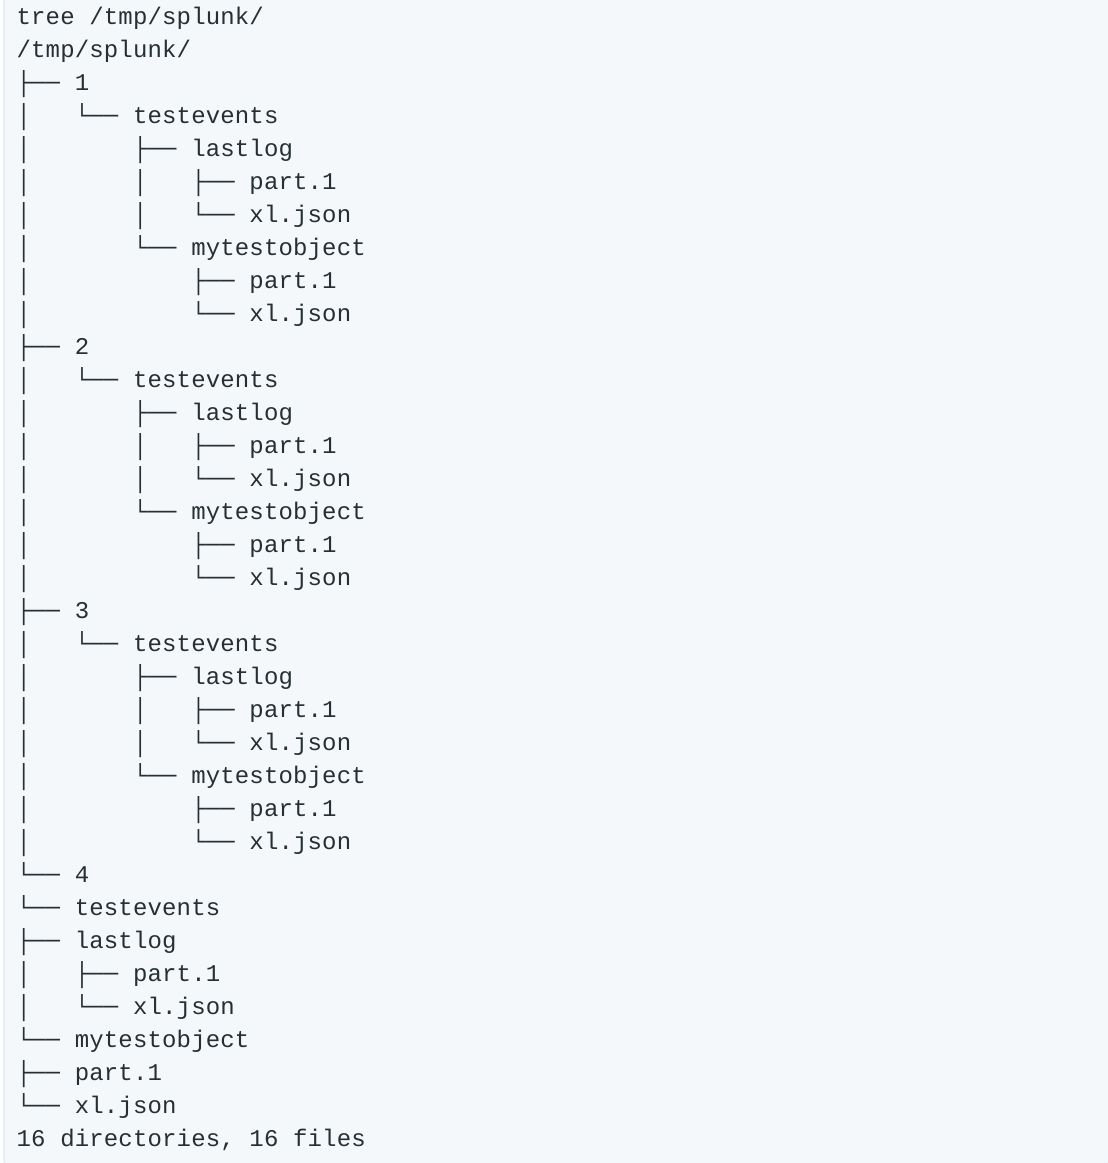
In short, there are four folders (“disks”) each containing some amount of the data or parity for the mytestobject we uploaded earlier. Let’s start by “removing” two of the “disks” (remember in this test environment, these aren’t real disks, just folder paths, but removing them simulates yanking the disks out of a running server).
rm -rf /tmp/splunk/{1..2}
Now our tree command shows things are in bad shape.
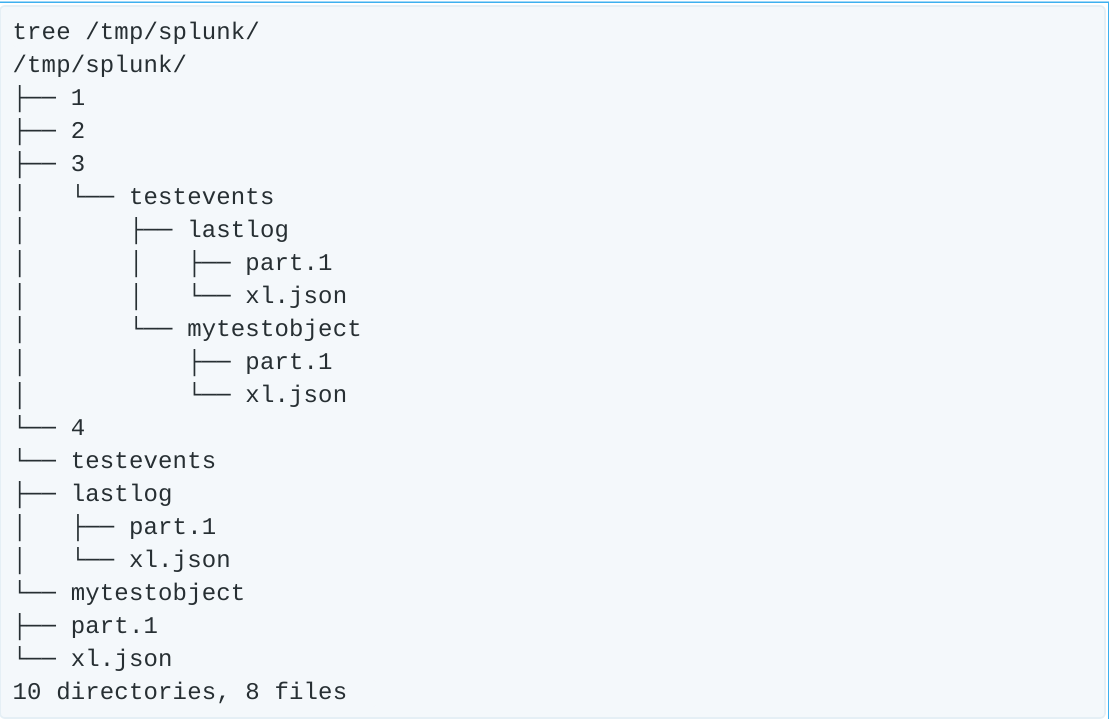
Half of the “disks” in our setup are empty. Let’s see what got logged in Splunk.
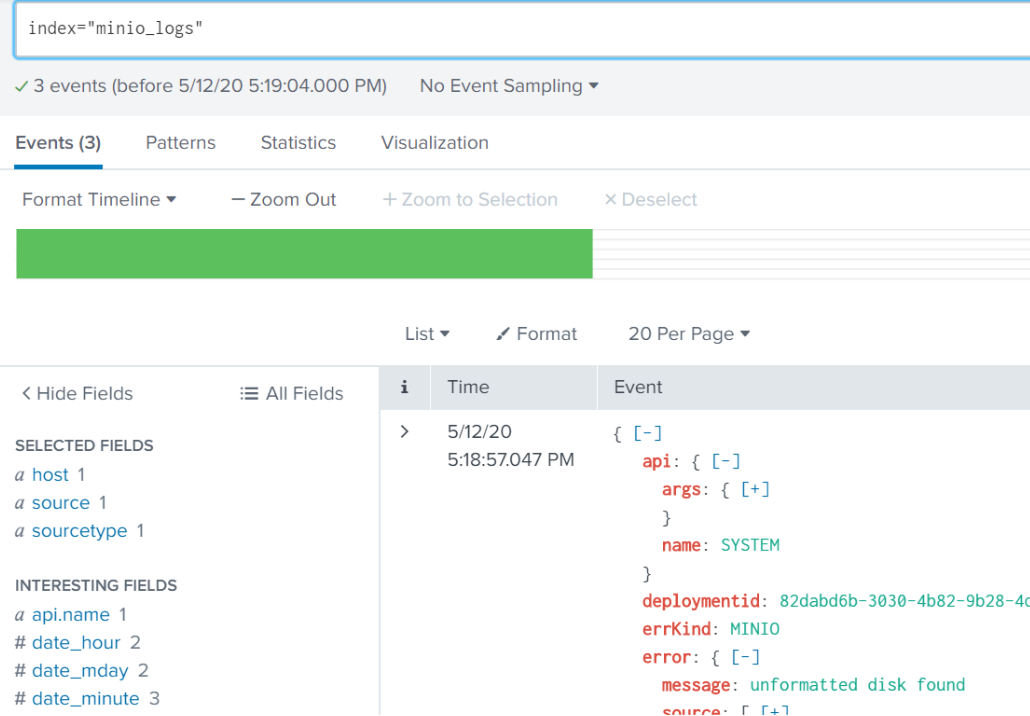
AIStor reports that it sees some empty disks with the field message: unformatted disk found. In a typical production setup, losing a few disks (or even a few servers) is not a big deal, as AIStor is built to handle large scale failures. But, in our tiny little test setup, we have lost half our disks, and if we lose any more we won’t have access to the data. Now that we know what we are looking for, we can configure Splunk to visually call out such an event. In Settings -> Event Types (under the “Knowledge” heading), create a New Event Type. For our test, we will set it up like this:
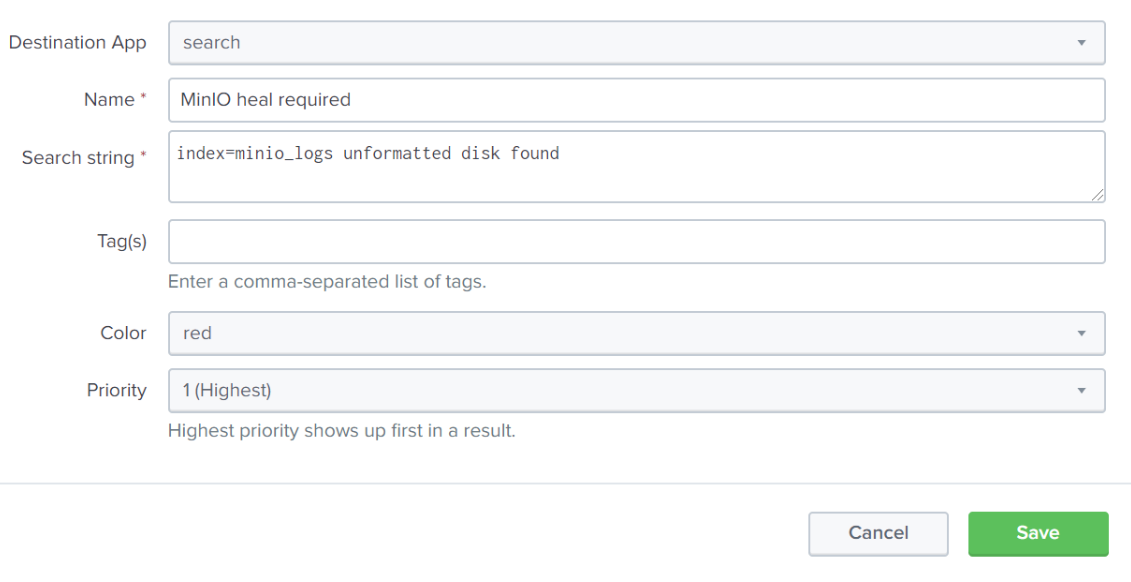
Now as we are browsing events in the minio_logs index, we will see a giant red banner letting us know that the unformatted disk event we configured is here, and needs attention. In a large-scale deployment, AIStor will automatically correct the situation by launching a heal process. In a large-scale deployment I can wait, but here I don’t want to take the risk, so I will manually launch a recursive heal on the AIStor server.

Now that the heal is complete, we verify the backend data is intact.
Everything is back in order, and we can continue on with our day.
Conclusion
Splunk is increasingly ubiquitous in the enterprise. With the rise of machine data, their deployments have proliferated and they have 10s of thousands of customers at this point. One is to use AIStor as a SmartStore endpoint - reducing Splunk costs while enabling additional scale - all without sacrificing performance. Another is to leverage Splunk's industry leading log analysis capabilities to optimize the performance of your AIStor deployment.
Both offer the ability to make the most of your data - by securing it, learning from it and extracting value from it. Give it a try on your own. If you need a little help, check out our documentation. You can also check out our public Slack channel as well and reach out to us at hello@min.io.