Multi-Cloud Monitoring and Alerting with Prometheus and Grafana
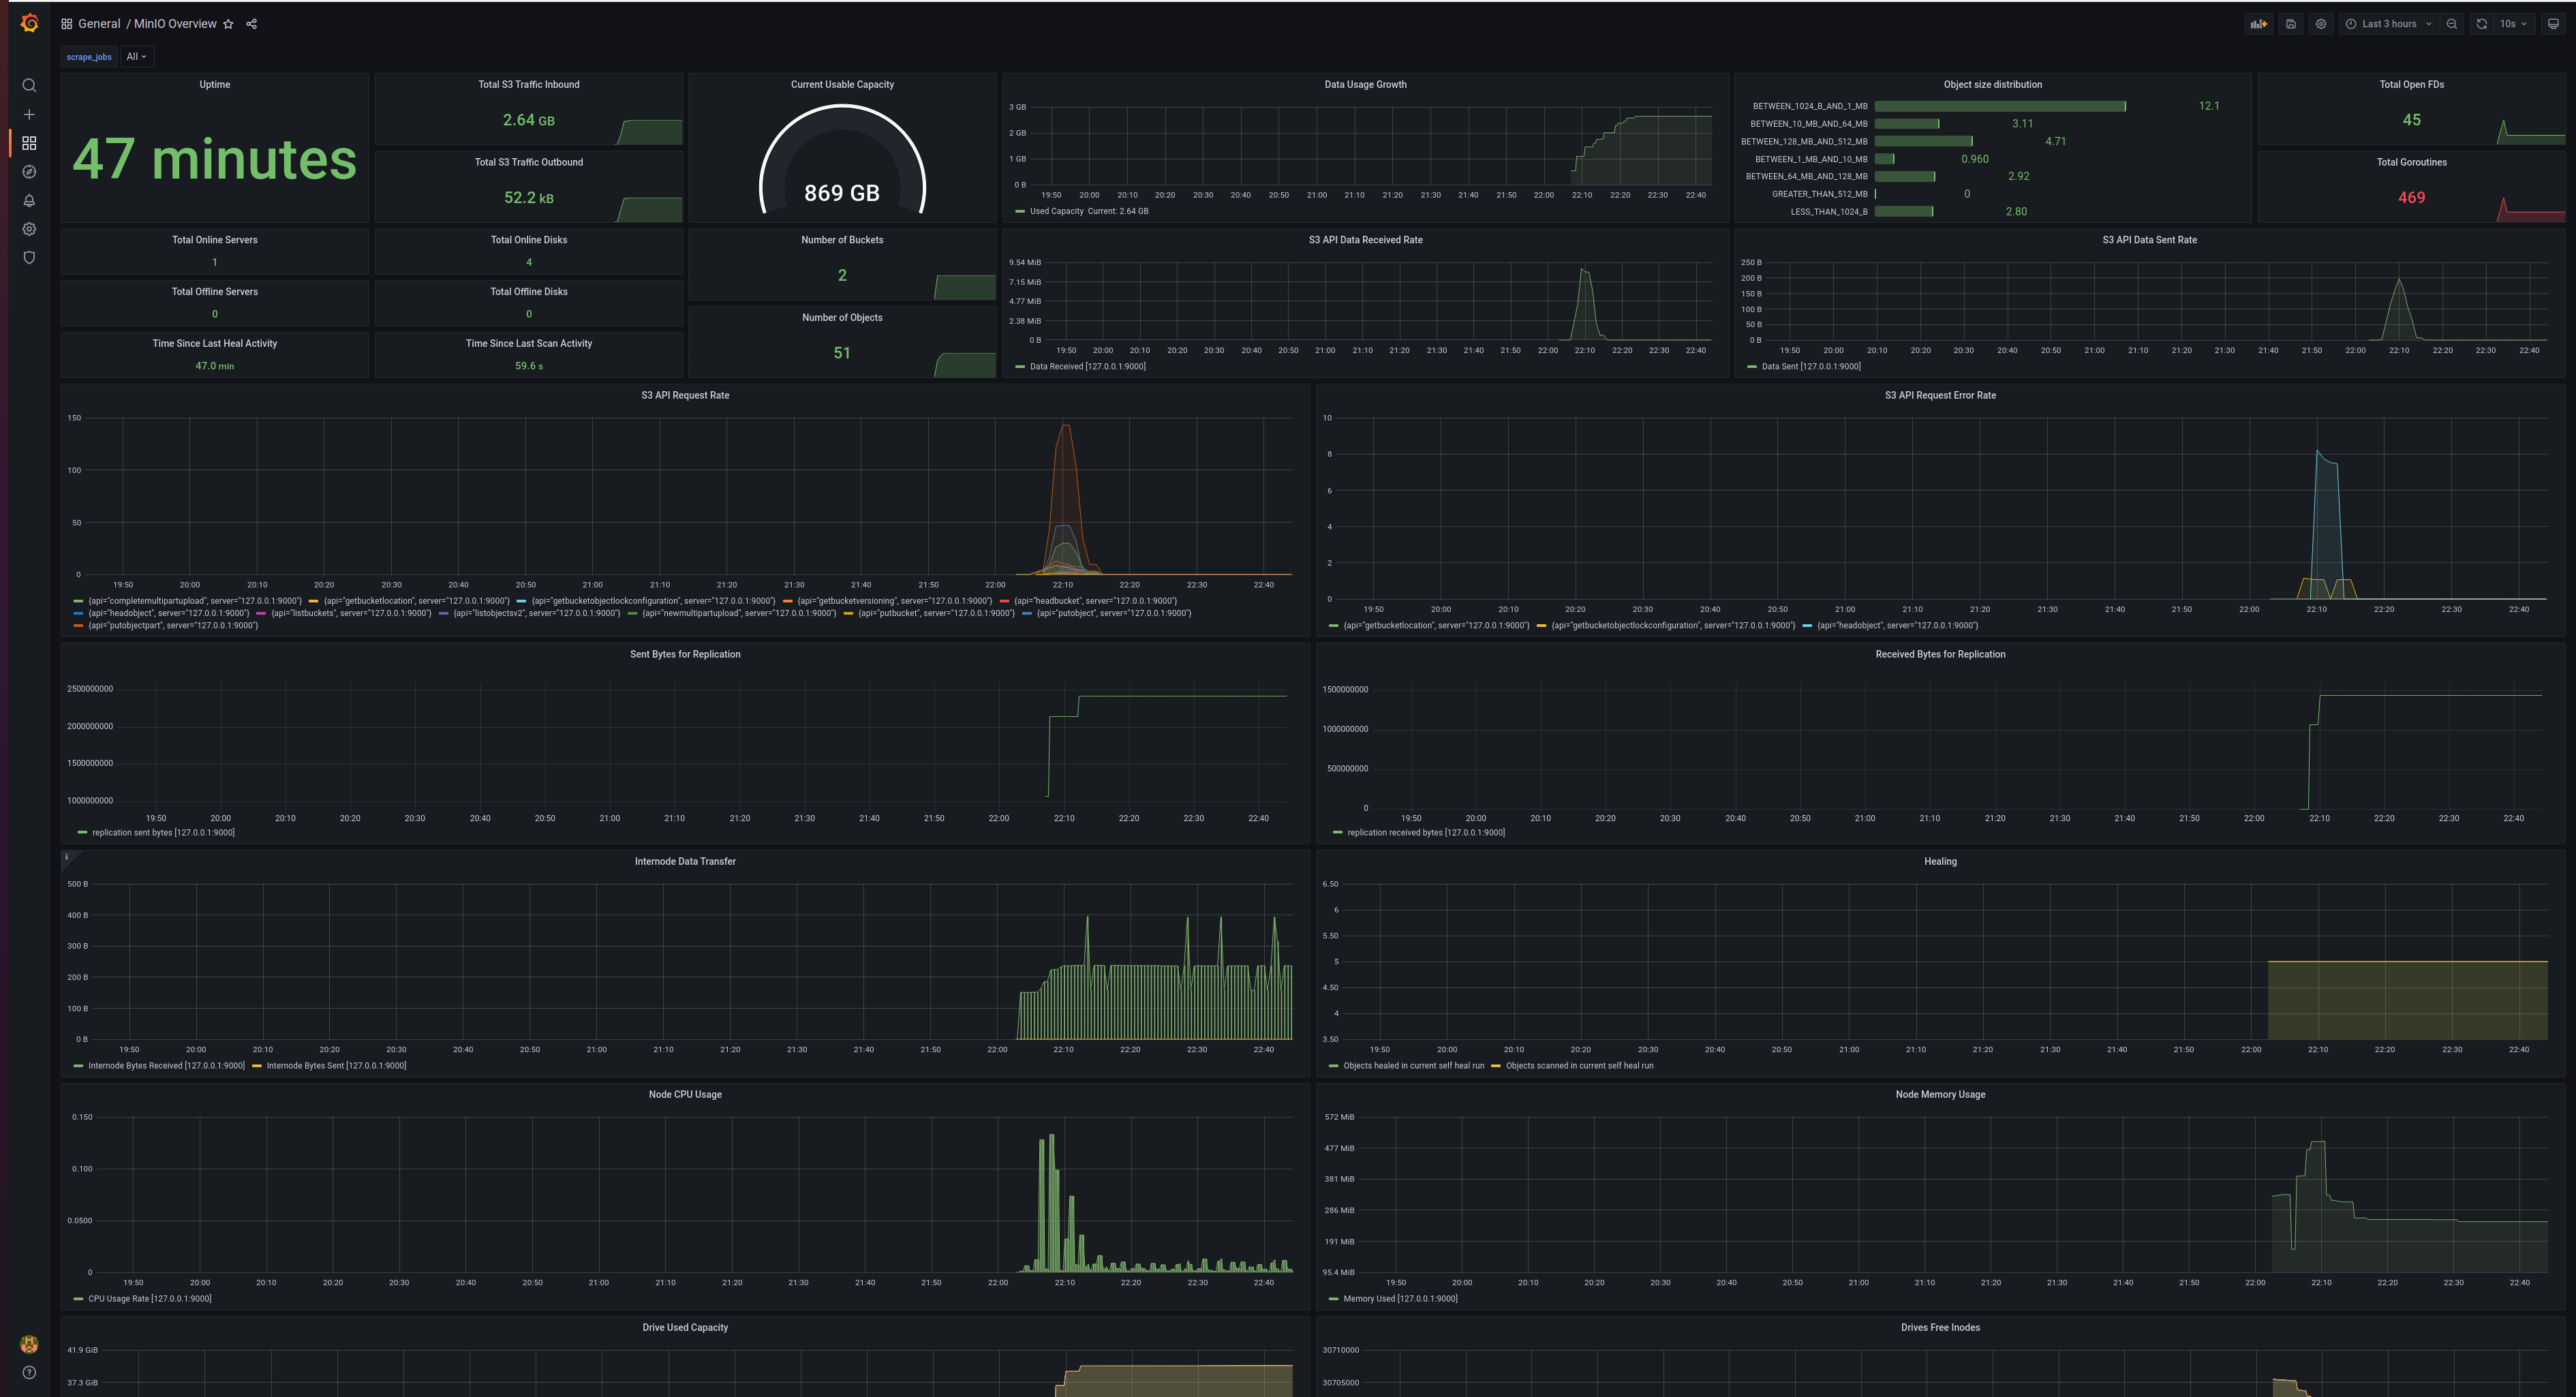
Monitoring the health and performance of infrastructure hardware and software is vital to maintaining application performance, reliability and availability.
The cloud-native world relies on a de-facto observability stack of Prometheus to collect and store metrics and Grafana for building dashboards, queries and alerts on them. The Prometheus server scrapes HTTP endpoints to collect metrics and Grafana connects to Prometheus to provide an easy way to visualize the metrics stored within Prometheus’s multi-dimensional time-series database. Prometheus can be combined with Alertmanager to issue notifications, and Grafana can issue them directly.
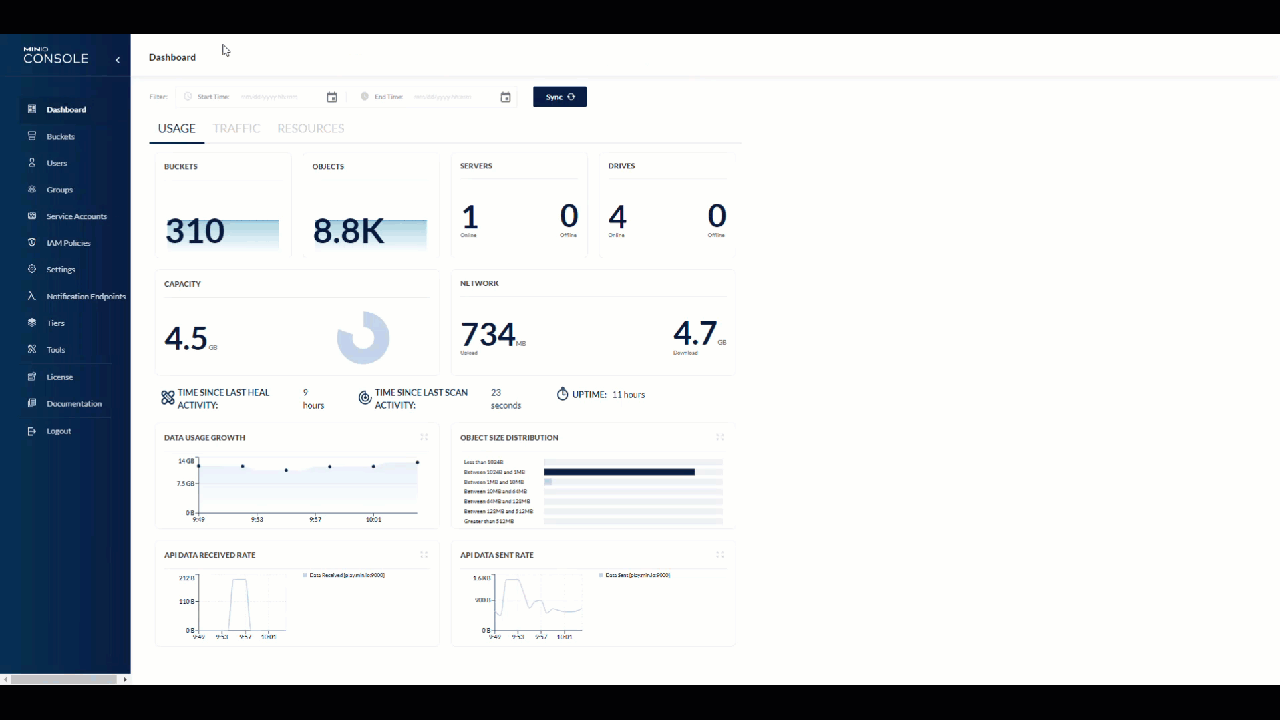
MinIO provides an HTTP endpoint for scraping Prometheus compatible data. The easiest way to view it is with MinIO Console. We also provide a Grafana dashboard to visualize collected metrics; we recommend Grafana when you want to customize dashboards and reports. Alternatively, you could use any other software that reads Prometheus metrics. Prometheus pulls a wide range of granular hardware and software metrics from MinIO.
One great thing about Prometheus is that it is everywhere - and so is MinIO. You can gain insight into your entire multi-cloud with Prometheus Federation, a method of scaling Prometheus to monitor environments that span multiple data centers and their nodes. A setup might involve many Prometheus servers to collect metrics on a local level and a global set of Prometheus servers to collect and store aggregated metrics, all connected securely. Organizations typically rely on a setup like this to monitor and alert on everything that provides metrics via a Prometheus-compatible endpoint. In this example, you could monitor and alert on MinIO clusters running anywhere through a single Grafana instance. Note that Prometheus/Grafana/Alertmanager can all be configured for high availability.
Key MinIO Metrics
Metrics are reported cluster-wide with a label for each node. There are currently 26 metrics collected. It’s important to baseline each metric to understand what typical and peak usage looks like. Deviations from the normal baseline may indicate potential errors or hardware failures. In many cases, the size of the deviation correlates to its severity - you may be able to ignore a 5% bump in S3 API requests, but a 25% surge demands attention. For some metrics, like offline servers, you probably want to take action on any change.
Whether you use Prometheus, Grafana, or another monitoring/alerting application, some of the most important metrics to keep an eye on include:
- Total Online/Offline Servers: Quickly see the total number of MinIO nodes online and offline to make sure they are available. MinIO can tolerate node failures of up to half of your servers, depending on configuration, but it goes without saying that you should investigate the offline servers.
- Total Online/Offline Disks: Offline disks are tolerable, but not desired. Depending on erasure coding settings, MinIO can tolerate the loss of up to half of its drives. We have an erasure code calculator to help you determine the optimal configurations for your needs.
- S3 API Data Received/Sent Rate: Histograms show S3 API traffic to and from MinIO. An unanticipated and large decline could indicate lost connectivity and should be investigated. Likewise, a massive surge would warrant investigation to determine where it is coming from and why.
- S3 API Request Rate: Displays a histogram of S3 API calls by MinIO node and operation, providing insight into how each node is being used.
- S3 API Request Error Rate: While there are always going to be some errors, a surge in error rate may warrant a deeper look at application and MinIO logs. Gather more information by checking logs to see what happened or running
mc admin traceto see live API calls. - Data Usage Growth: It’s important to track to understand the total size of data stored in MinIO and how it grows over time in order to predict the need for and timing of server poll expansion.
- Object Size Distribution: This metric is helpful for planning and tuning for workloads.
- Node CPU/Memory/Drive Usage: Of course it’s important to know drive utilization when you’re managing storage. CPU and memory utilization is less important because MinIO is optimized and makes efficient use of the resources. keep an eye on these to maintain peak performance.
- Node File Descriptors: A file descriptor is an unsigned integer used by a process to identify an open file and can be configured in the underlying operating system. If file descriptors is set too low, it will limit the number of concurrent operations on your MinIO cluster. MinIO currently defaults to 1048576 file descriptors. Settings can easily be managed via systemd.
Now that we’ve touched on some of the most important MinIO metrics to track, let’s take a look at how to install and configure Prometheus and Grafana for monitoring and alerting.
Prometheus and MinIO Tutorial
It’s straightforward to install Prometheus and configure it to scrape MinIO endpoints. The installation process is fully described in How to monitor MinIO server with Prometheus. You will need to have MinIO installed first.
Download the latest release of Prometheus and extract it.
Configure MinIO for the authentication type for Prometheus metrics. MinIO supports both JWT and public authentication modes. By default, MinIO runs in JWT mode, and we recommend JWT mode for production environments. We can use public mode for testing. See documentation to enable authentication.
From a command prompt, configure an environmental variable
and restart MinIO server.
With our Prometheus endpoint authentication set to public, we can configure our endpoint scrape in prometheus.yml. Open the file and edit the scrape_configs section. You will only need to scrape a single endpoint, i.e. one node or load-balanced IP address, to monitor the cluster.
To monitor a MinIO cluster:
After you save the file, you’re ready to run Prometheus.
You can now view MinIO metrics in Prometheus by launching a browser and navigating to http://localhost:9090.
Grafana and MinIO Tutorial
After Prometheus is configured, use Grafana to visualize MinIO metrics gathered by Prometheus.
Download the latest release of Grafana and expand it.
If you wish to configure Grafana prior to first launch, you can edit its config file (/etc/grafana/grafana.ini) to set configuration options such as the default admin password, http port, and much more.
Start Grafana.
Alternatively, to start Grafana with systemd or init.d see Install on Debian or Ubuntu.
Log in to Grafana with a web browser at http://localhost:3000/. The first time you will need to log in using admin for username and password. You will be prompted to change your password.
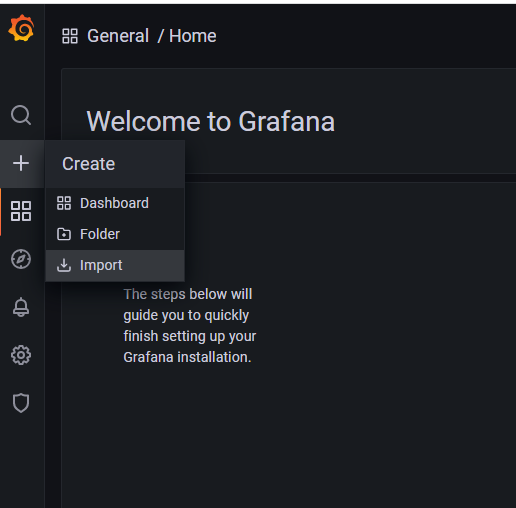
To install the MinIO Grafana dashboard, click on the plus sign and select Import.
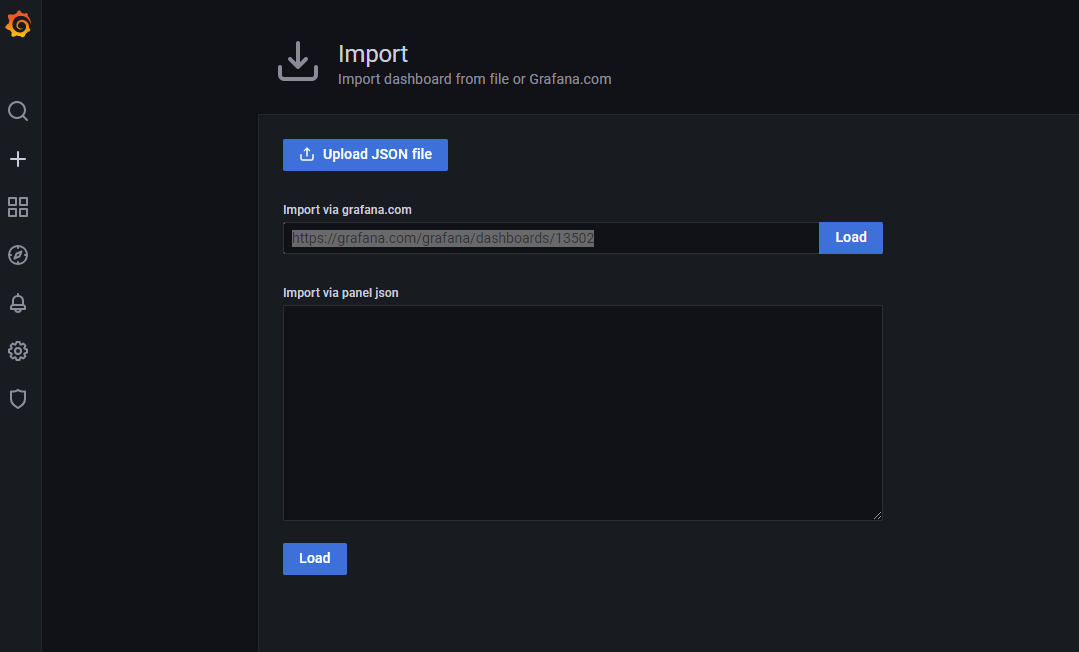
Enter https://grafana.com/grafana/dashboards/13502 to import the MinIO dashboard. A separate dashboard for replication setups is also available - https://grafana.com/grafana/dashboards/15305.
The final necessary configuration is to select the Prometheus data source to be used to populate the MinIO dashboard.
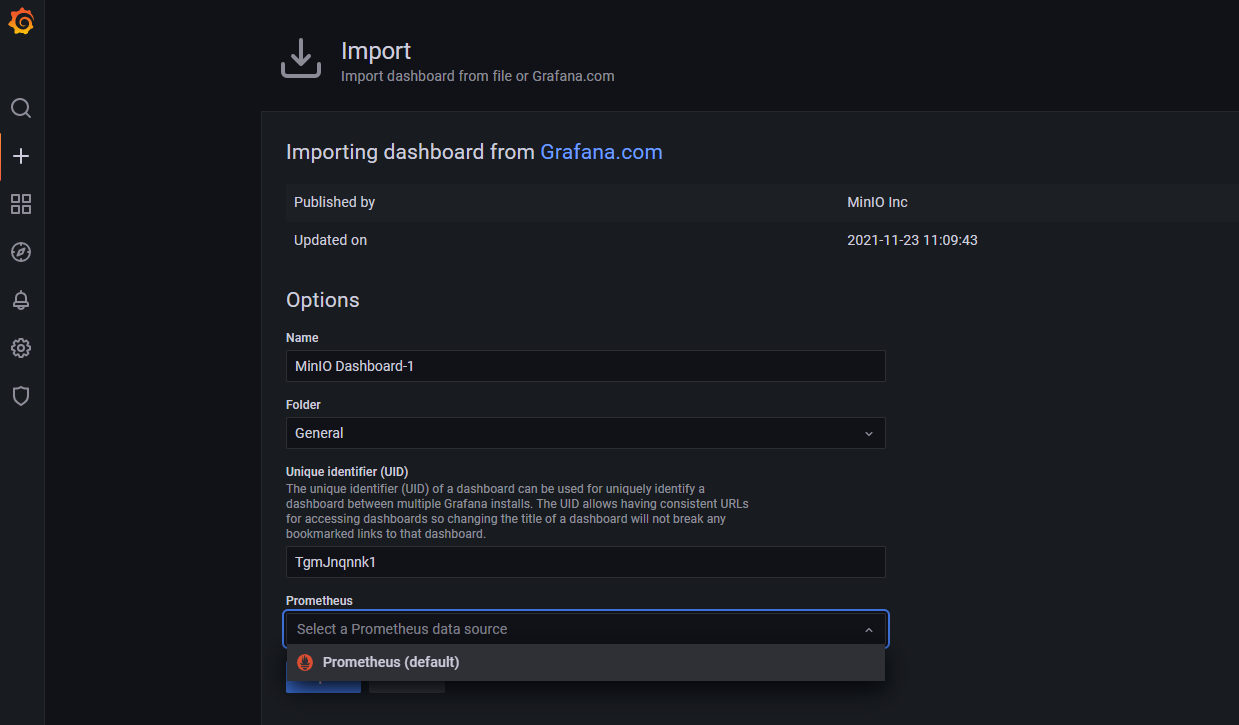
After you click Import, the MinIO dashboard will open.
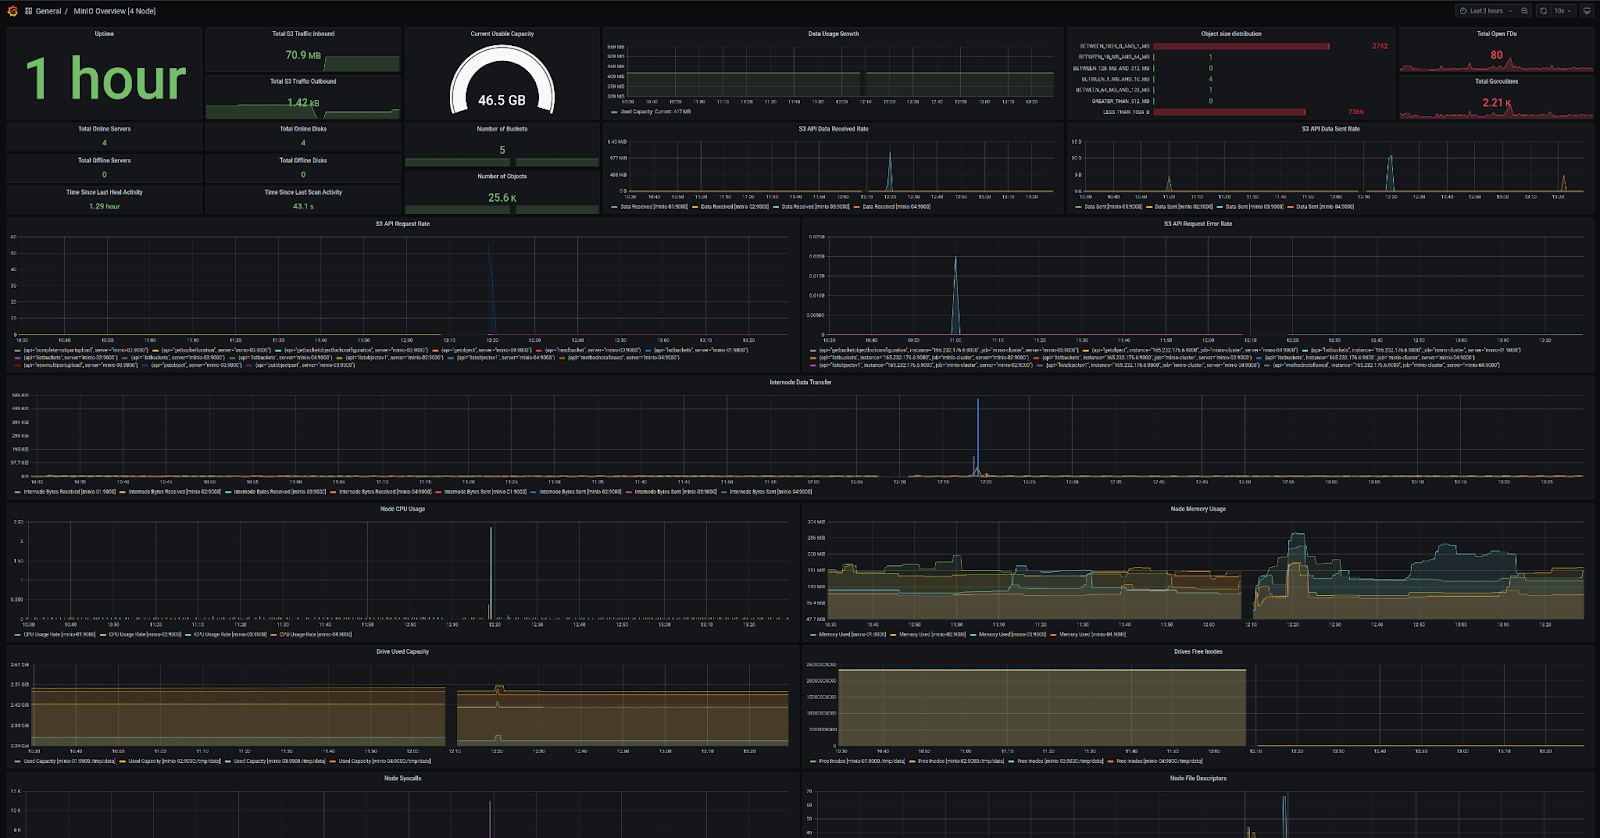
Whether you’re using the MinIO Grafana dashboard or MinIO Console, all the metrics you need to verify optimal performance and availability are at your fingertips.
To go beyond passive monitoring, let’s take a quick look at alerting.
Alerting with Prometheus, Grafana and AlertManager
There are two ways to define alert conditions and issue notifications: Prometheus and AlertManager, or Grafana. It’s easier to configure alerts using Grafana’s visual interface, but the drawback is that you’ll need to keep Grafana server running to issue notifications, which adds another moving piece to your infrastructure. Alert rules written in Prometheus can be more complex (both a blessing and a curse), and have the advantage of being issued from Alertmanager, which can be configured for high availability. For these reasons, Prometheus and Alertmanager are more commonly used in production than Prometheus and Grafana for alerting.
Alerts in Prometheus live as YAML files that are loaded when the server starts. Alert rules define conditions using Prometheus expression language. Whenever an alert definition is met, the alert counts as active. Active alerts can be viewed in a web browser or trigger a notification in Alertmanager. Alertmanager handles deduplicating, grouping and routing notifications to predefined services such as email, webhook, PagerDuty, and more.
The process involves setup and configuration of Alertmanager, configuring Prometheus to communicate with Alertmanager and creating alert rules in Prometheus.
Let’s take a look at an example alerting rule from Prometheus. We’re going to issue an alert that results in a page if a MinIO node goes down.
As alerting in Grafana is configured via GUI, it’s an easier and faster way to learn how to configure and issue alerts. We’re going to run through a quick demo, for a more in-depth guide see Overview of Grafana alerting.
First, create a notification channel that will be used to send the alert. Click Notification Channels under Alerting, then click Add Channel.
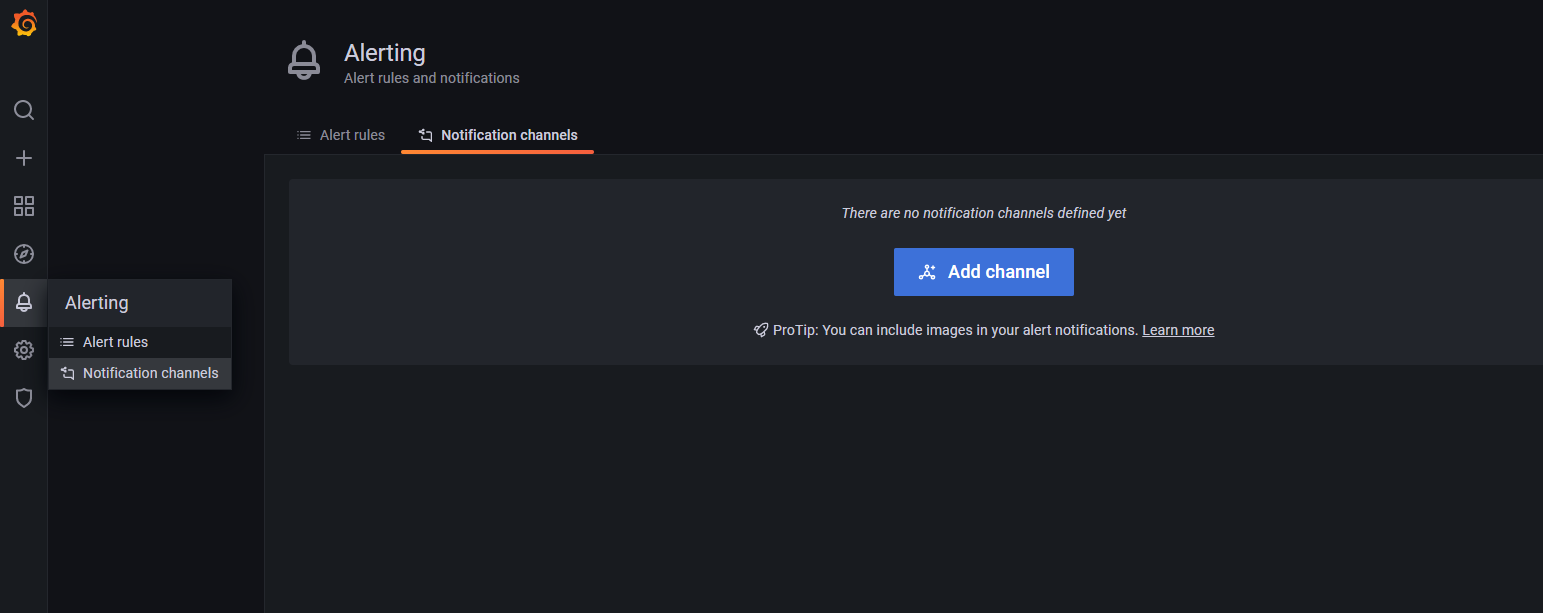
Select the notification target that you want to use from the Type dropdown. There are many options, including PagerDuty, Email, Prometheus/Alertmanager, Slack and webhook. Select webhook from the menu. Webhook is an easy solution when testing because we don’t need an email server or a service account to verify that the notification is triggered.
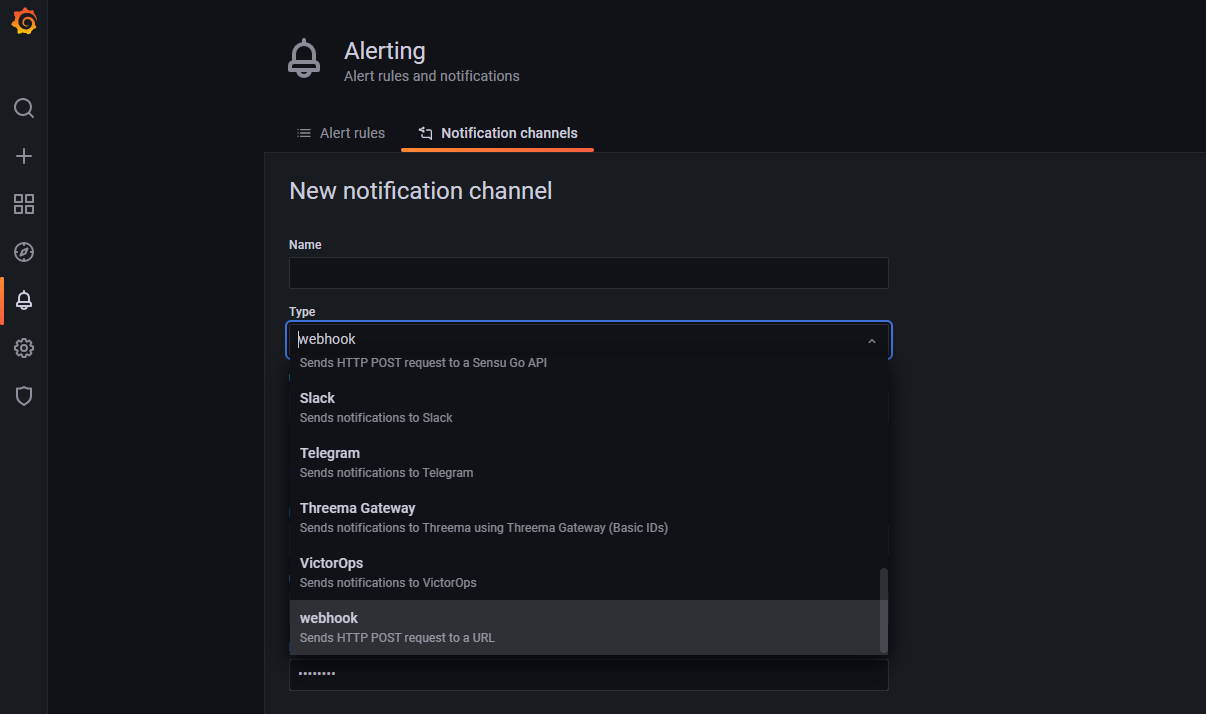
Browse to https://webhook.site. This is a useful tool for quick testing and for viewing the contents of a webhook. Copy your permalink. Go back to Grafana and paste the permalink into the URL field. Then click Test. Return to your webhook.site page to see if the test notification was sent successfully.
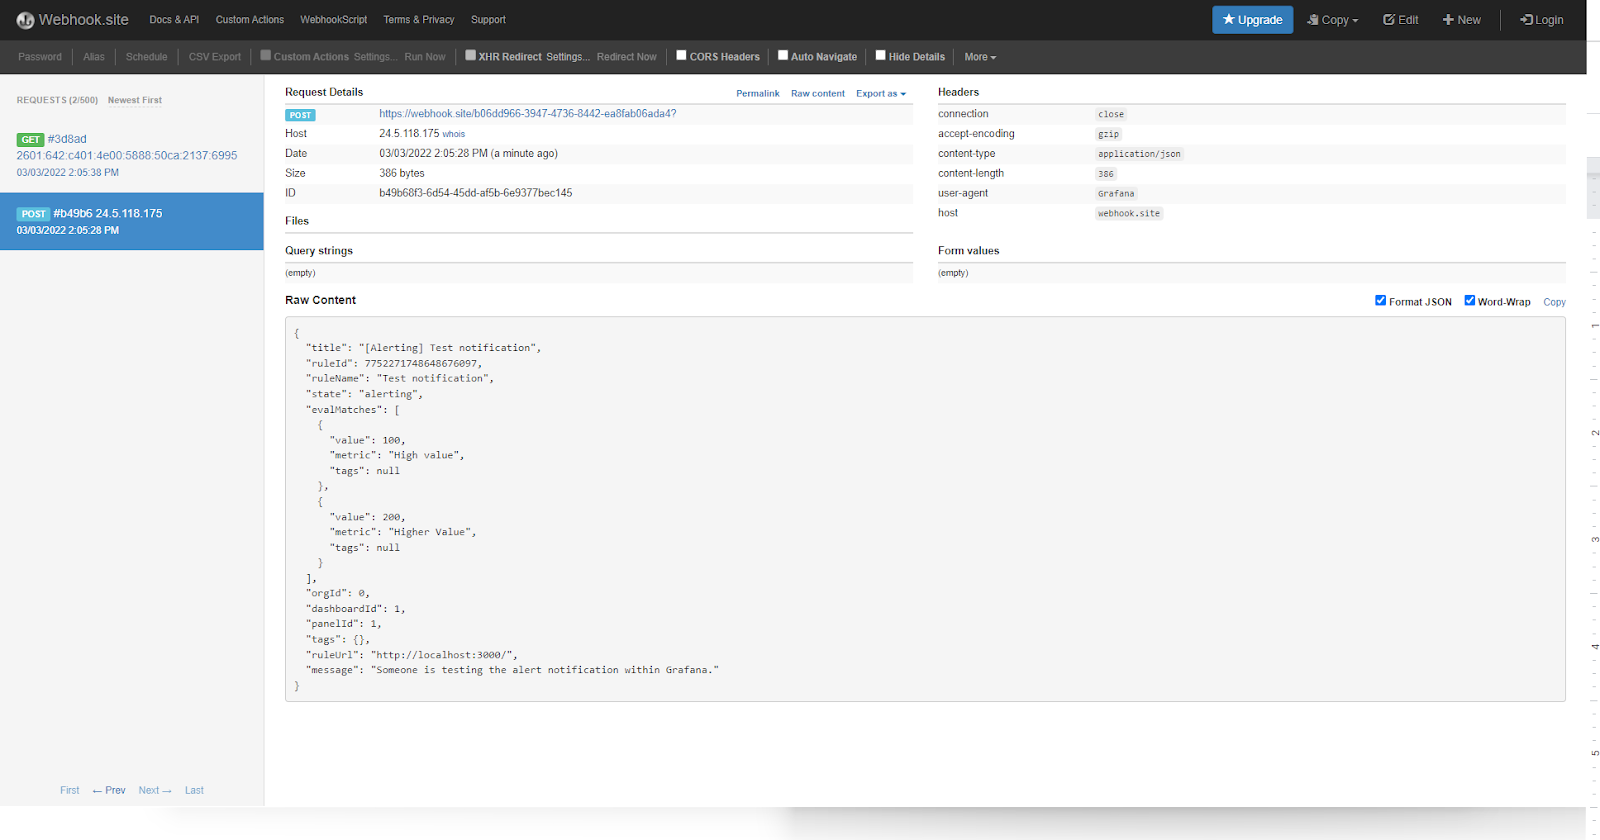
Save the notification channel and create a new dashboard by clicking on the plus and selecting Dashboard. Grafana does not allow for building alerts on template variables, so you can’t use variables defined by the MinIO dashboard to create alert rules.
Click to Add a new panel.
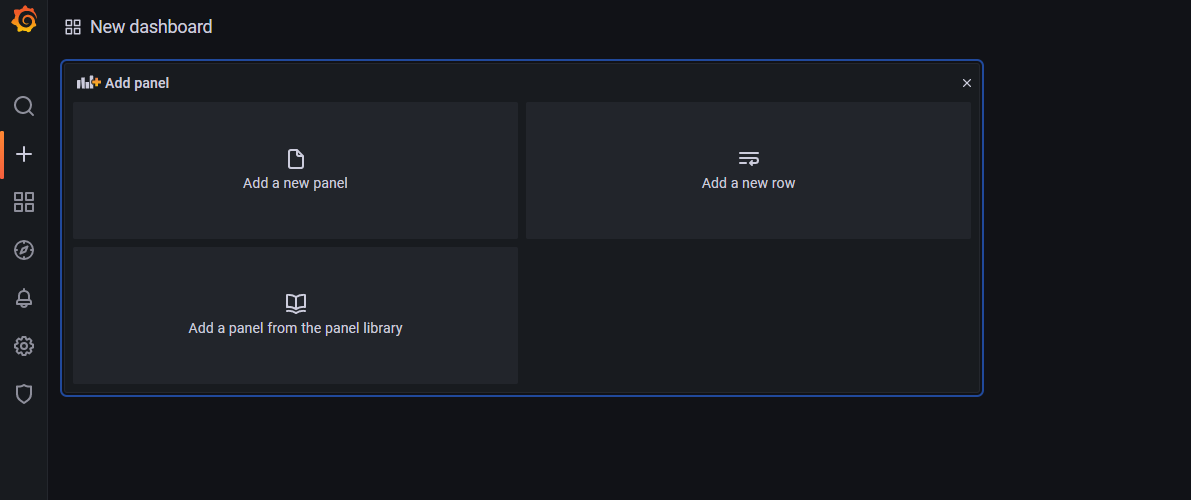
Creating the alert is a bit easier in Grafana because of the GUI that walks you through building a query expression.
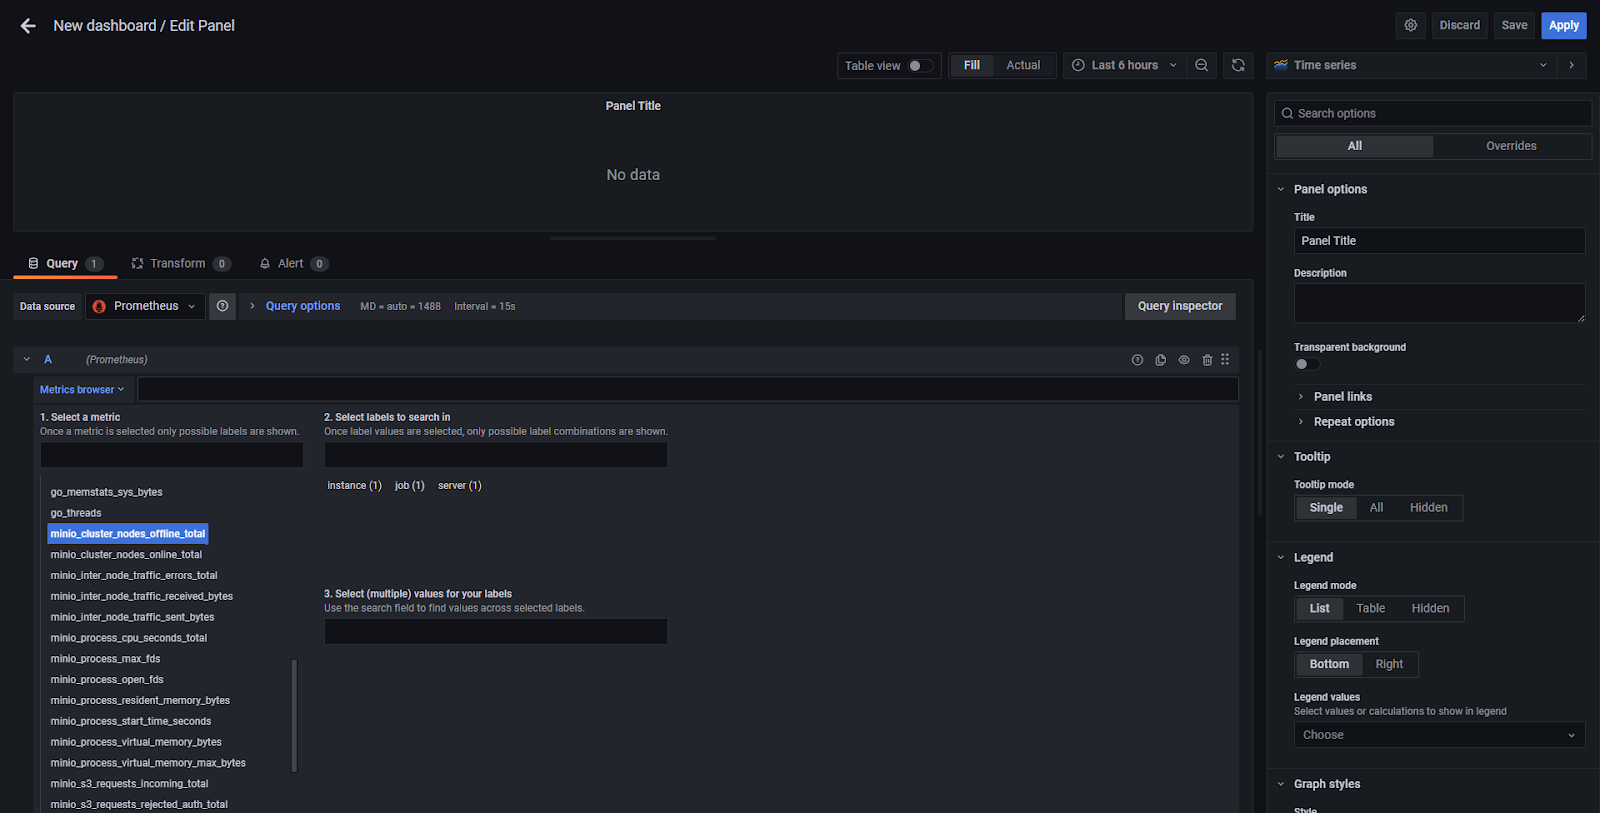
For our demo, select minio_cluster_nodes_offline_total. Then click on Alert and click on Create Alert.
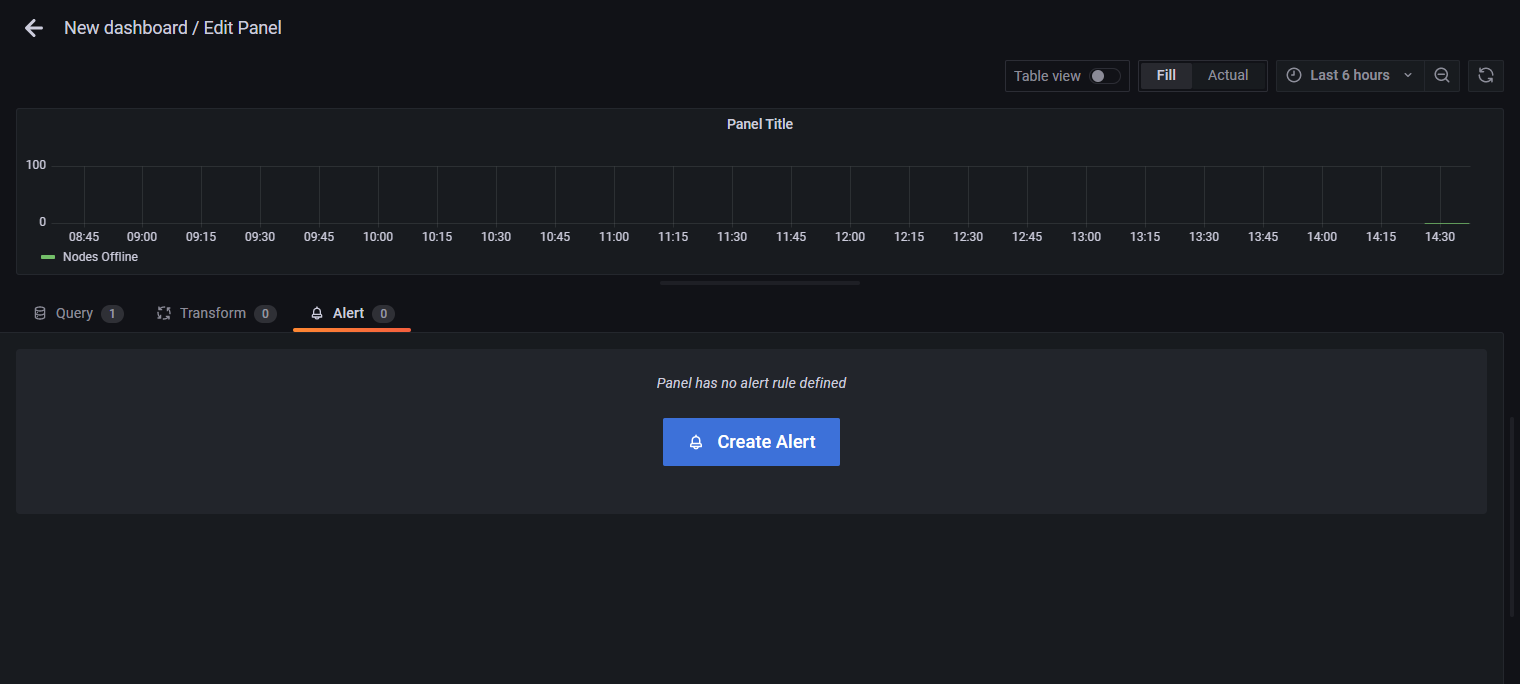
Give the alert rule a name if you like. In Conditions, we’re going to build a query that will trigger an alert if the number of nodes offline is greater than 0. We’re also going to configure to send an alert if no data is collected or if the query times out. Then choose Webhook under Notifications, Send to.
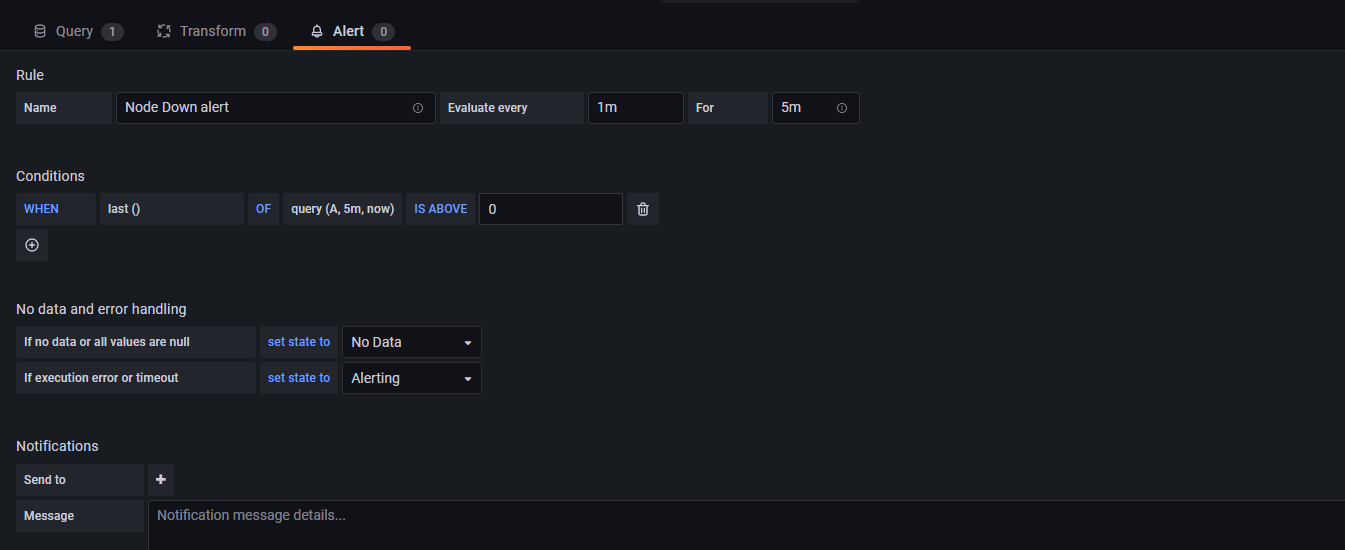
Click Apply in the top right corner to save your dashboard and alert. You’ve configured your first Grafana alert.
What’s that? You say you don’t want to create an error condition on your MinIO cluster. For demonstration purposes, I will take my MinIO node down.
You can see that this condition is reflected in the dashboard.
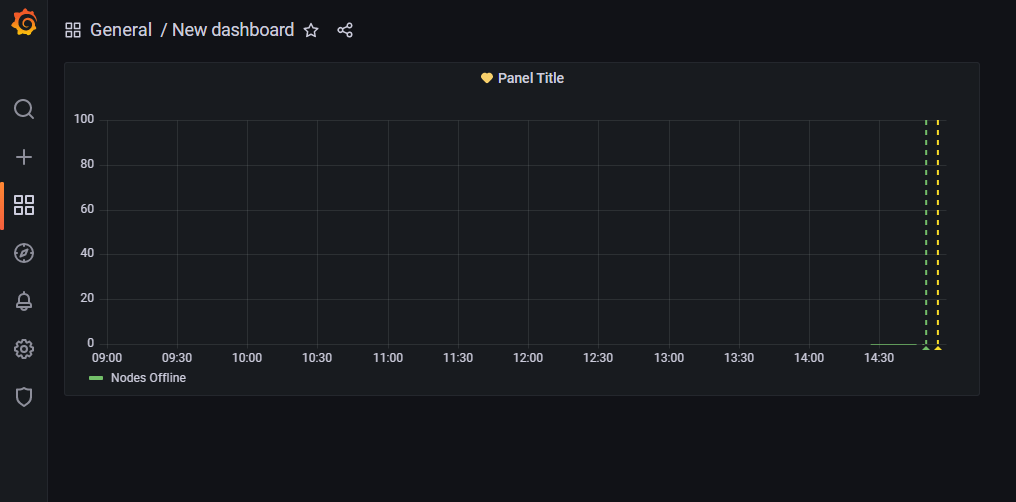
Grafana tells me that we’ve achieved error condition.

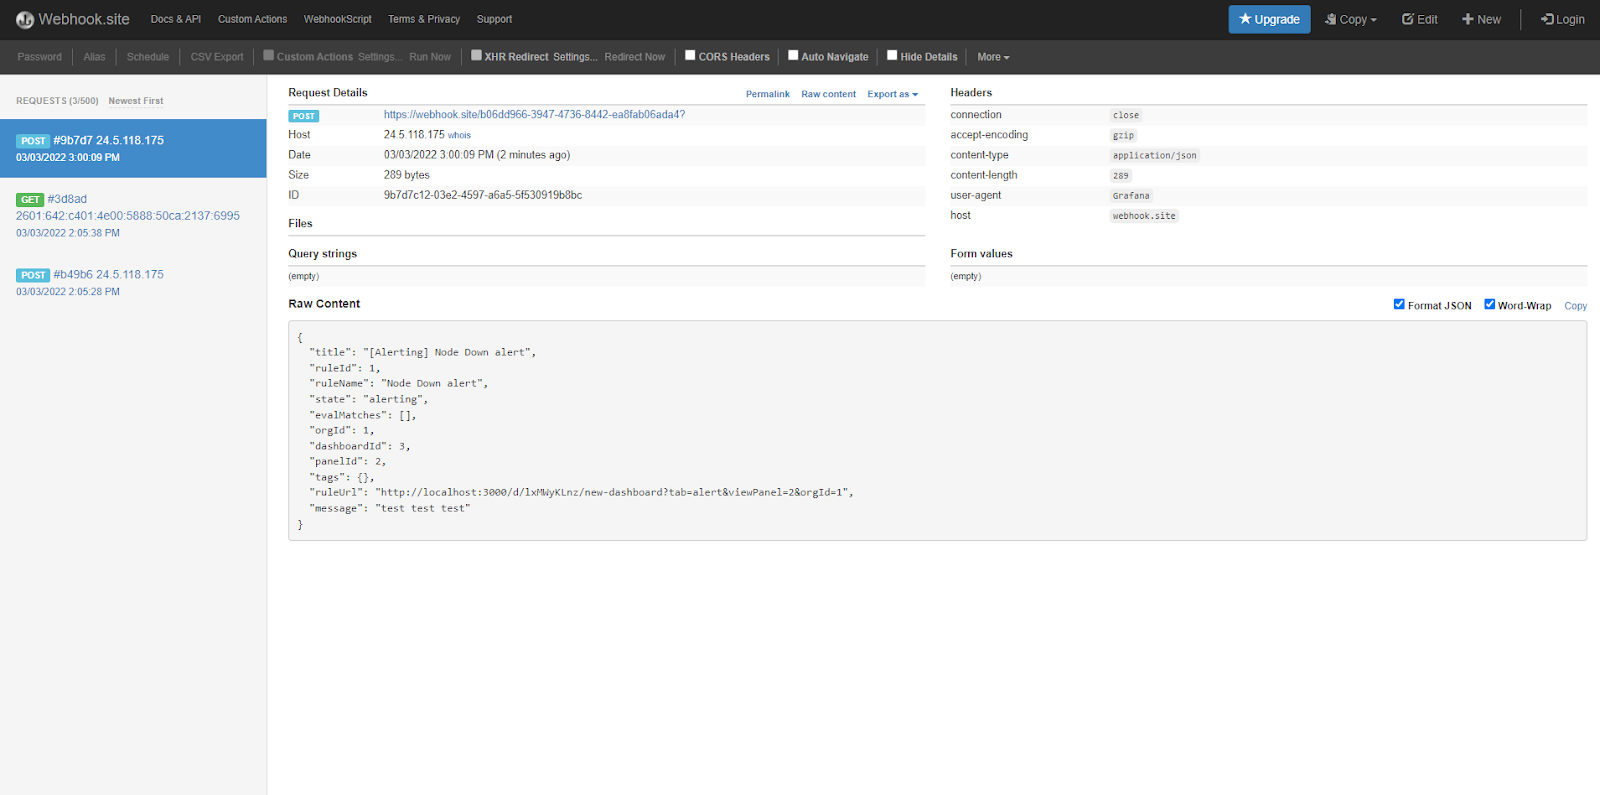
And my webhook has received the notification.
Complete Visibility for MinIO
MinIO provides a complete set of performance and health metrics via a Prometheus endpoint. The combination of Prometheus/Grafana/Alertmanager simplifies monitoring and alerting on MinIO metrics. This is a very rich topic and this demo is meant to be a starting point. There’s a lot more to learn! If you have questions, please join our Slack channel or send us an email at hello@min.io.


