Using OpenObserve with MinIO

Observability is all about gathering information (traces, logs, metrics) with the goal of improving performance, reliability, and availability. Seldom it's just one of these that would pinpoint the root cause of an event, more often than not it's when we correlate this information to form a narrative is when we’ll have a better understanding. As more organizations build observability stacks, they’re finding high-performance, S3-compatible and Kubernetes-native MinIO object storage indispensable.
As an engineer responsible for maintaining a stack, metrics are one of the most important tools you can use to understand your infrastructure. In the past, we’ve blogged about several ways you can measure and extract metrics from MinIO deployments using Grafana and Prometheus, Loki, ElasticSearch and OpenTelemetry, but you can use whatever you want to leverage MinIO’s Prometheus metrics. We invite you to observe, monitor and alert on your MinIO deployment – open-source MinIO is built for simplicity and transparency because that is how you operate at scale.
In the last few blogs on observability, we went through how to implement tracing in MinIO and sending MinIO logs to ElasticSearch, which showed how MinIO is the perfect companion for OpenObserve because of its industry-leading performance and scalability. MinIO has created a comprehensive blueprint for data infrastructure to support exascale AI and other large scale data lake workloads. It is called the MinIO DataPod. Why? Because exascale data is the reality that is common today in today's enterprise – and is used to build data lakes/lake houses and analytics and AI/ML workloads. With MinIO playing a critical role in storage infrastructure, it's important to collect, monitor and analyze performance and usage metrics for MinIO and the application stack it supports.
Today, we’re going to focus on OpenObserve and MinIO. OpenObserve is an open-source observability platform designed to streamline the monitoring of logs, metrics, and traces. Thanks to its compatibility with storage services such as Minio, OpenObserve significantly lowers storage costs - reducing them to about 140 times less than Elasticsearch.
We chose OpenObserve due to its simple learning curve and unified observability capabilities. Indeed, OpenObserve can be used to collect metrics, logs, and traces from a variety of sources, and it can be used to correlate this data to gain insights into the health of an application or system.
In this blog post, we will discuss how to
- Set up MinIO with a bucket for data streaming
- Configure MinIO as the OpenObserve backend and ingest log data
Let's get started.
MinIO
We’ll bring up a MinIO node with 4 disks. MinIO runs anywhere - physical, virtual or containers - and in this post we will use containers created using Docker.
For the 4 disks, create the directories on the host for minio:
Launch the Docker container with the following specifications for the MinIO node:
The above will launch a MinIO service in Docker with the console port listening on 20091 on the host. It will also mount the local directories we created as volumes in the container and this is where MinIO will store its data. You can access your MinIO service via http://localhost:20091.
If you see 4 Online that means you’ve successfully set up the MinIO node with 4 drives.
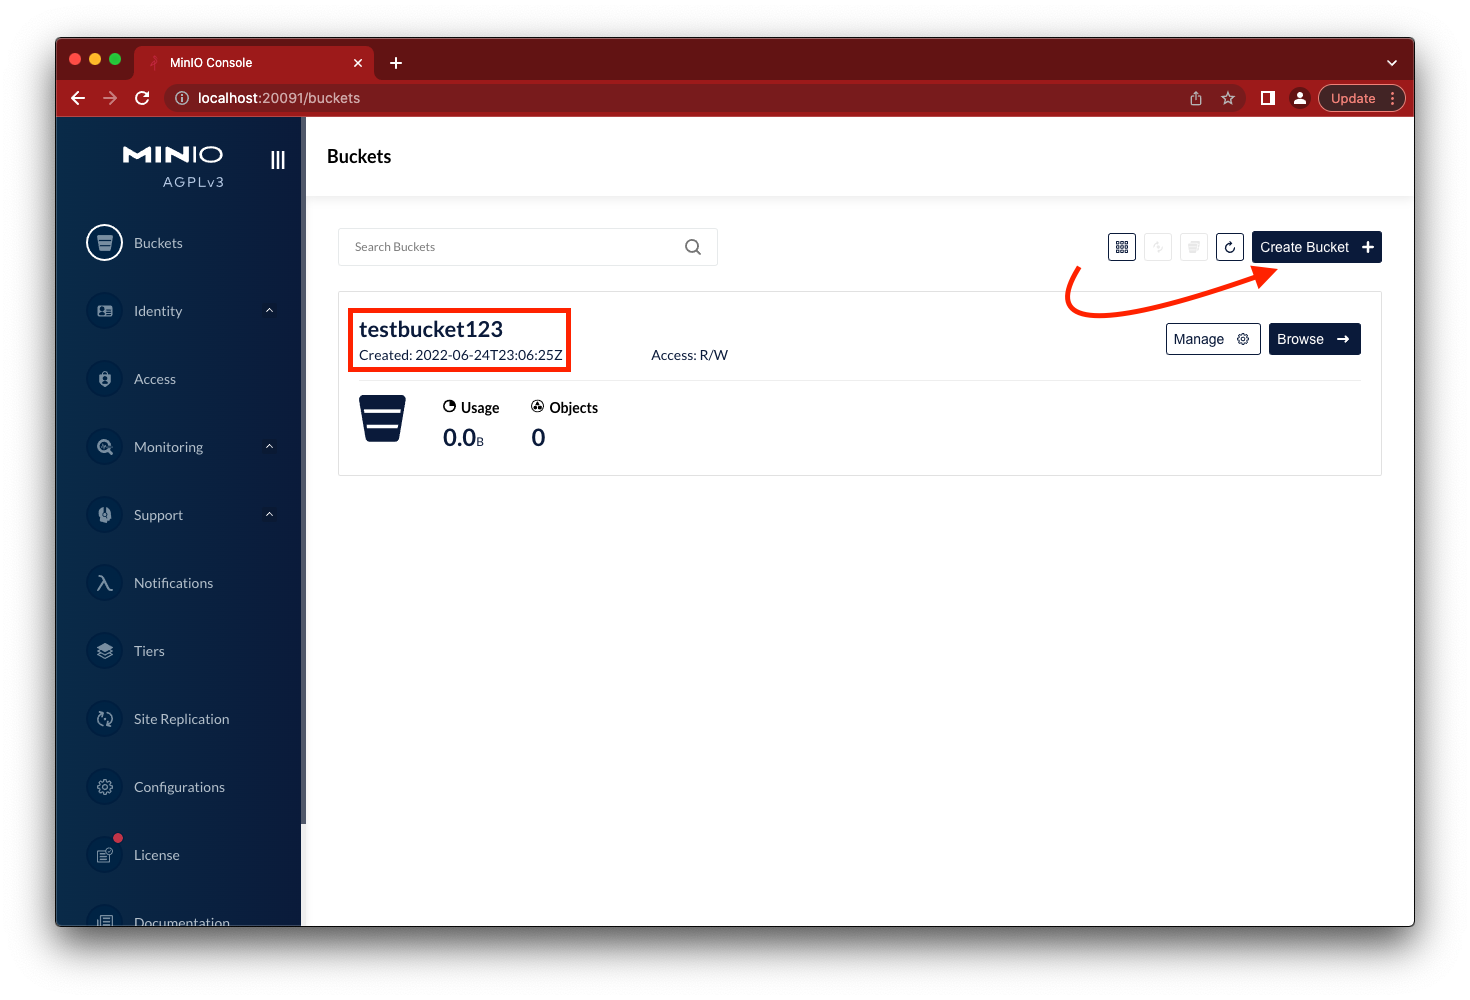
Go to the browser to load the MinIO Console using http://localhost:20091, log in using minioadmin and minioadmin for username and password respectively. Click on the Create Bucket button and create testbucket123.

While you’re in the MinIO Console, note that there is a point-in-time metrics dashboard that you can use for quick and easy monitoring.
OpenObserve
Before we set up OpenObserve let's discuss some of the basic architecture that goes into the deployment. There are 2 different types of data that OpenObserve needs to store based on whether it's deployed in local mode or cluster mode.
In local mode, the metadata can be stored either in the MinIO bucket and in cluster mode it has to be stored in etcd because of the distributed nature of the setup. On the other hand, the data in both local and cluster mode can be stored in a MinIO bucket.
In this iteration, we’ll show you how to set up the OpenObserve hosted installation in your on-prem data center.
To get started quickly we’ll set it up using Docker. Pick a docker image from the list below
If its local storage we would create a folder locally but in this case, we’ll have it storing data straight into the MinIO bucket we created earlier. There are several environment variables available to configure MinIO, we’ll go through some of them for better understanding.
- ZO_S3_SERVER_URL: This is the MinIO endpoint URL; http://localhost:20091
- ZO_S3_ACCESS_KEY: This is the default username of the MinIO deployment; minioadmin
- ZO_S3_SECRET_KEY: This is the default password of the MinIO deployment; minioadmin
- ZO_S3_BUCKET_NAME: We created this bucket after our MinIO deployment; testbucket123. This bucket must be created beforehand, OpenObserve will not create it and error out if it does not pre-exist.
- ZO_S3_PROVIDER: Since we are using MinIO as the stream backend we’ll generally set this to minio. But the beauty of MinIO is its compatibility with S3 SDK, so if you need to use specific S3 features like force_style=true then set this to s3.
- ZO_S3_REGION_NAME: This can be anything, we’ll set it to us-east-1.
These are the ones that are absolutely necessary. For more optional variables see the documentation.
We’ll now incorporate those above variables into the docker run command below
You should now have an OpenObserve instance that has been launched and is in a running state. But before we are able to see any meaningful dashboards and make queries on them we’ll load a couple of sample data.
Download the sample log data
We’ll use OpenObserve’s API with the credentials set when launching the container to load this sample data
Once the data has been ingested visit the OpenObserve UI using the URL http://localhost:5080 and login with the same credentials used to ingest data.
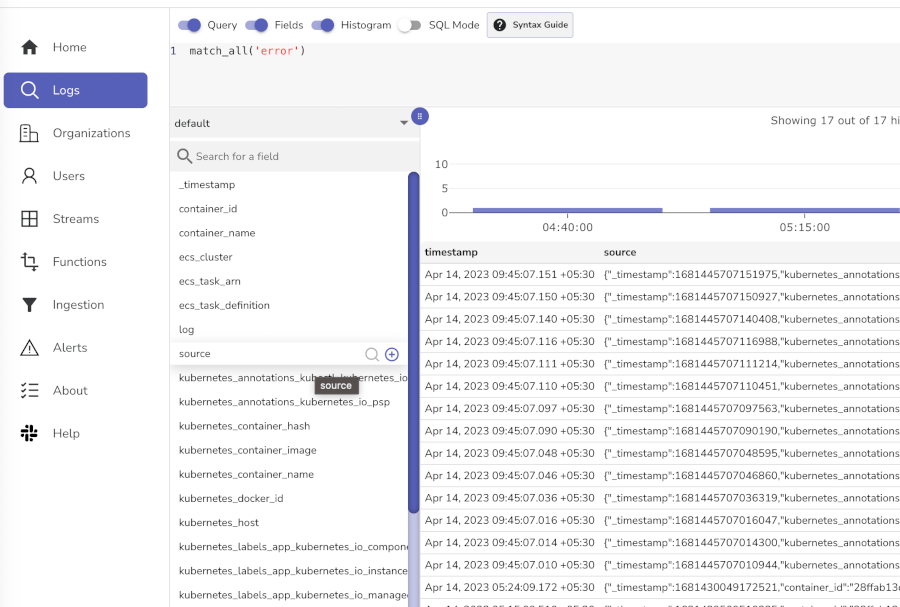
Visit the Logs page on the left and select the default index. In the search bar type match_all('error') and click the Search button.

Final Words
With any infrastructure, especially critical infrastructure such as storage, it’s paramount that the systems are monitored with reasonable thresholds and alerted on as soon as possible. It is not only important to monitor and alert but also do trending for long-term analysis on the data. For example, let's say you suddenly notice your MinIO cluster using up tremendous amounts of space, it would be good to know whether this amount of space was taken up in the past 6 hours or the past 6 weeks or even the past 6 months. Based on this you can decide whether you need to add more space or clean up existing inefficiently used space. Not only can you use this to monitor MinIO, but you can also monitor your entire Infrastructure so you get a holistic view of the ecosystem which will help you correlate issues when they arise.
If you have questions about setting up new OpenObserve or have existing dashboards that you built for MinIO, and would like to share with us, please reach out to us on Slack!


