SUBNET HealthCheck and Performance

The MinIO Subscription Network (SUBNET for short) accompanies a commercial subscription and provides peace of mind - from the dual license model (AGPL and Commercial) to the direct-to-engineering support model.
This post focuses on some of the features associated with this unique model and is the second in a series that details the features and capabilities that come with a commercial relationship. You can find the first post, on the methods of communication and direct-to-engineer experience here.
HealthCheck
In order to have a comprehensive understanding of the client system, MinIO developed a capability called HealthCheck which is available only to commercial customers.
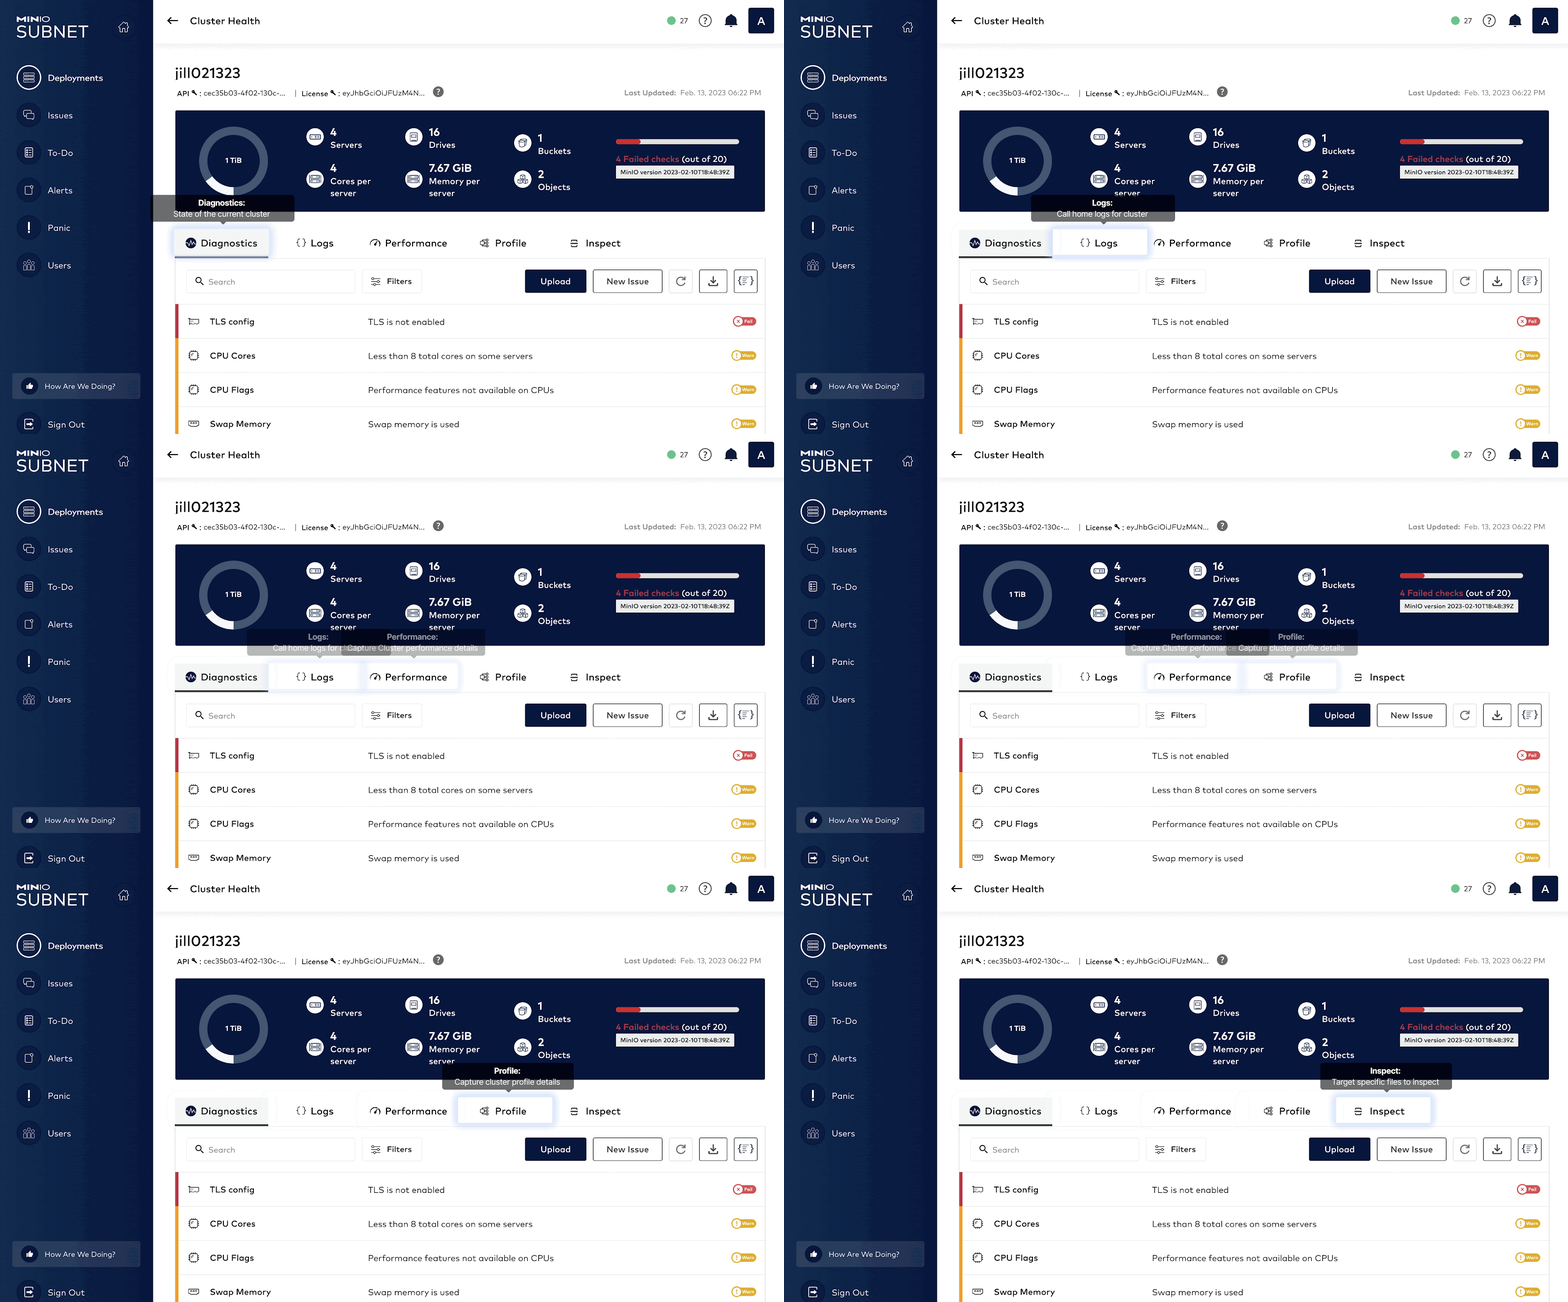
HealthCheck provides a graphical user interface for supported components and runs diagnostics checks continually to ensure your environment is running optimally. It also catalogs every hardware and software component to ensure consistency across the environment while surfacing any discrepancies. This speeds up root cause analysis and issue remediation by quickly identifying performance and integration issues.
Configuring SUBNET
Before we send any of this data to SUBNET let’s register our cluster with the SUBNET portal. We always recommend that our clients register their clusters - it helps us help them and is highly secure. Registering the cluster is by far the easiest and most efficient way to get this information across. That being said, if you are in an airgap configuration with no outbound access, you can also use the --airgap flag to generate the diagnostics and upload it to the SUBNET portal manually.
As you can see, it's pretty simple to get connected and started. Once it's registered successfully you should see a message like above.
Diagnostics
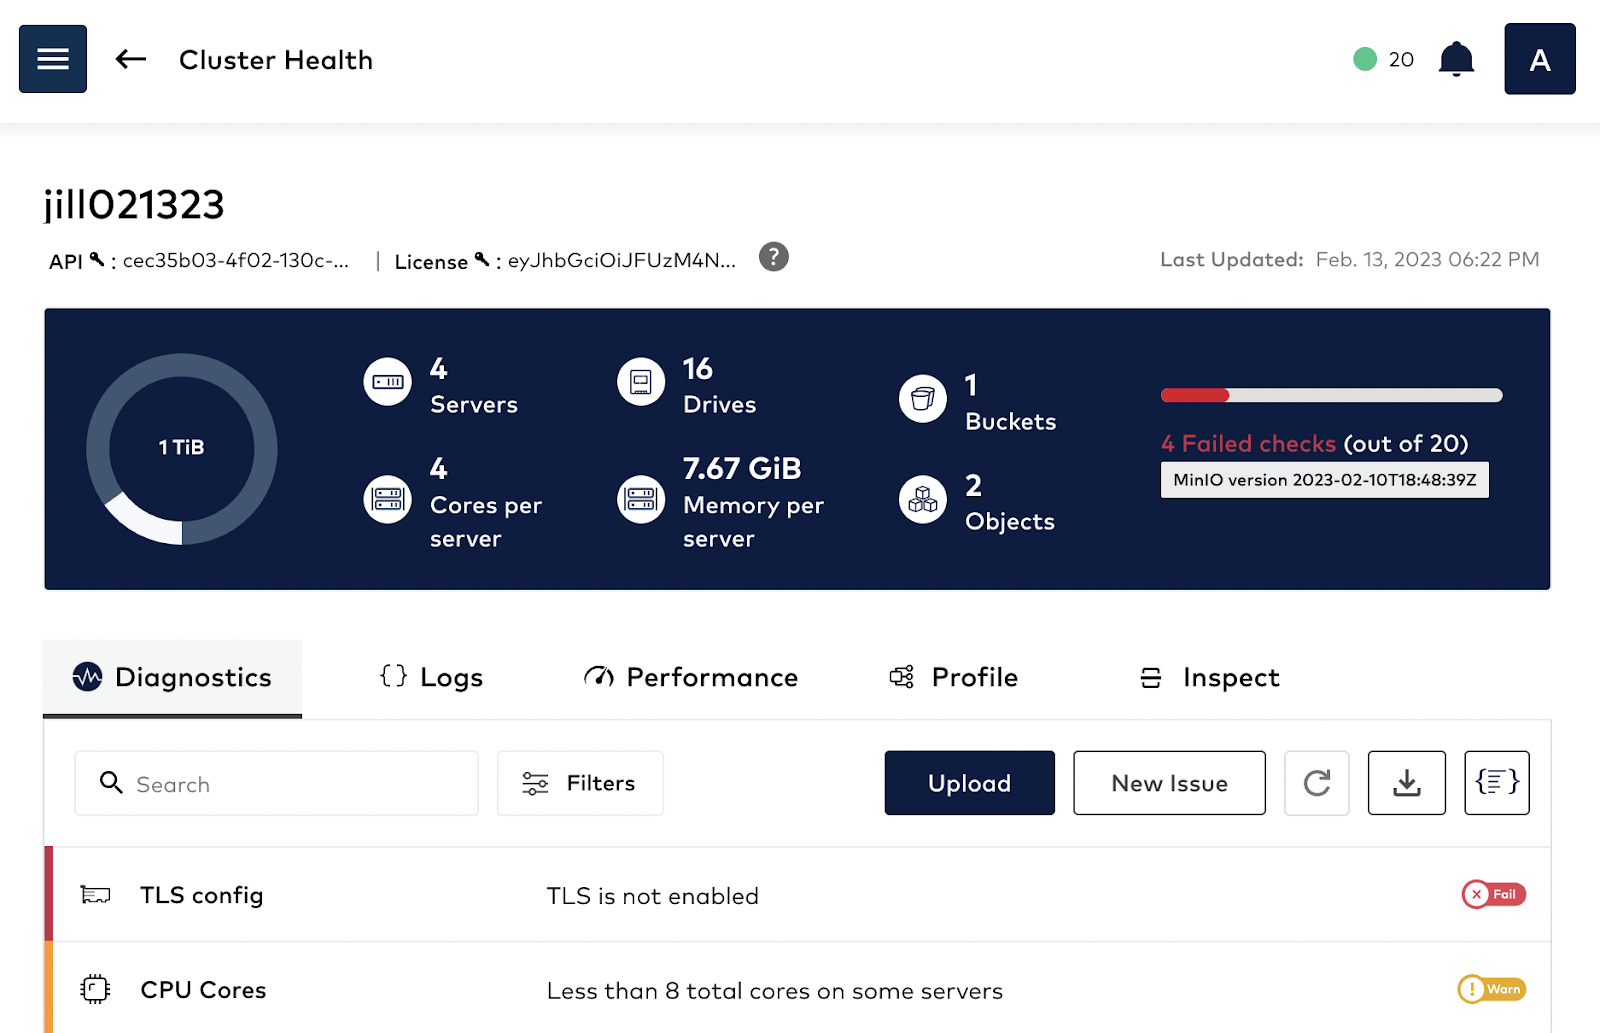
Let’s start with the Diagnostics tab. The Diagnostics tab is the equivalent of a deep scan. It reviews all of the performance characteristics of the instance and identifies the areas that might be worthy of further investigation/consideration. We’ll go through each of the areas in detail.
TLS config
The TLS diagnostic will check to see if TLS is enabled in the cluster. It's important to have TLS enabled and configured even internally between the cluster communication so everything is secure. You can use MinIO’s certgen command to generate self-signed certificates, which can be used to evaluate the installation with TLS enabled.
CPU Cores
MinIO recommends a minimum of 8 CPU cores on the nodes where MinIO is running to ensure the infrastructure is not underpowered. Generally, if you have less than 8 total cores on servers, this will show a “Warn”. It's paramount that within the same pool the same set of nodes are configured so they are as homogeneous as possible. Here is MinIO’s recommended hardware checklist that goes into detail about some of these hardware requirements.

Swap Memory
If you see an issue with Swap Memory it is telling us two things: The cluster is out of physical memory and whatever memory it is using is slow because it is reading it from the disk. As a general rule, MinIO recommends that the server use the physical memory as much as possible and SWAP should be disabled altogether. Reason being swap is memory stored on disk which can cause performance issues as reading from disk is a lot slower than physical memory.
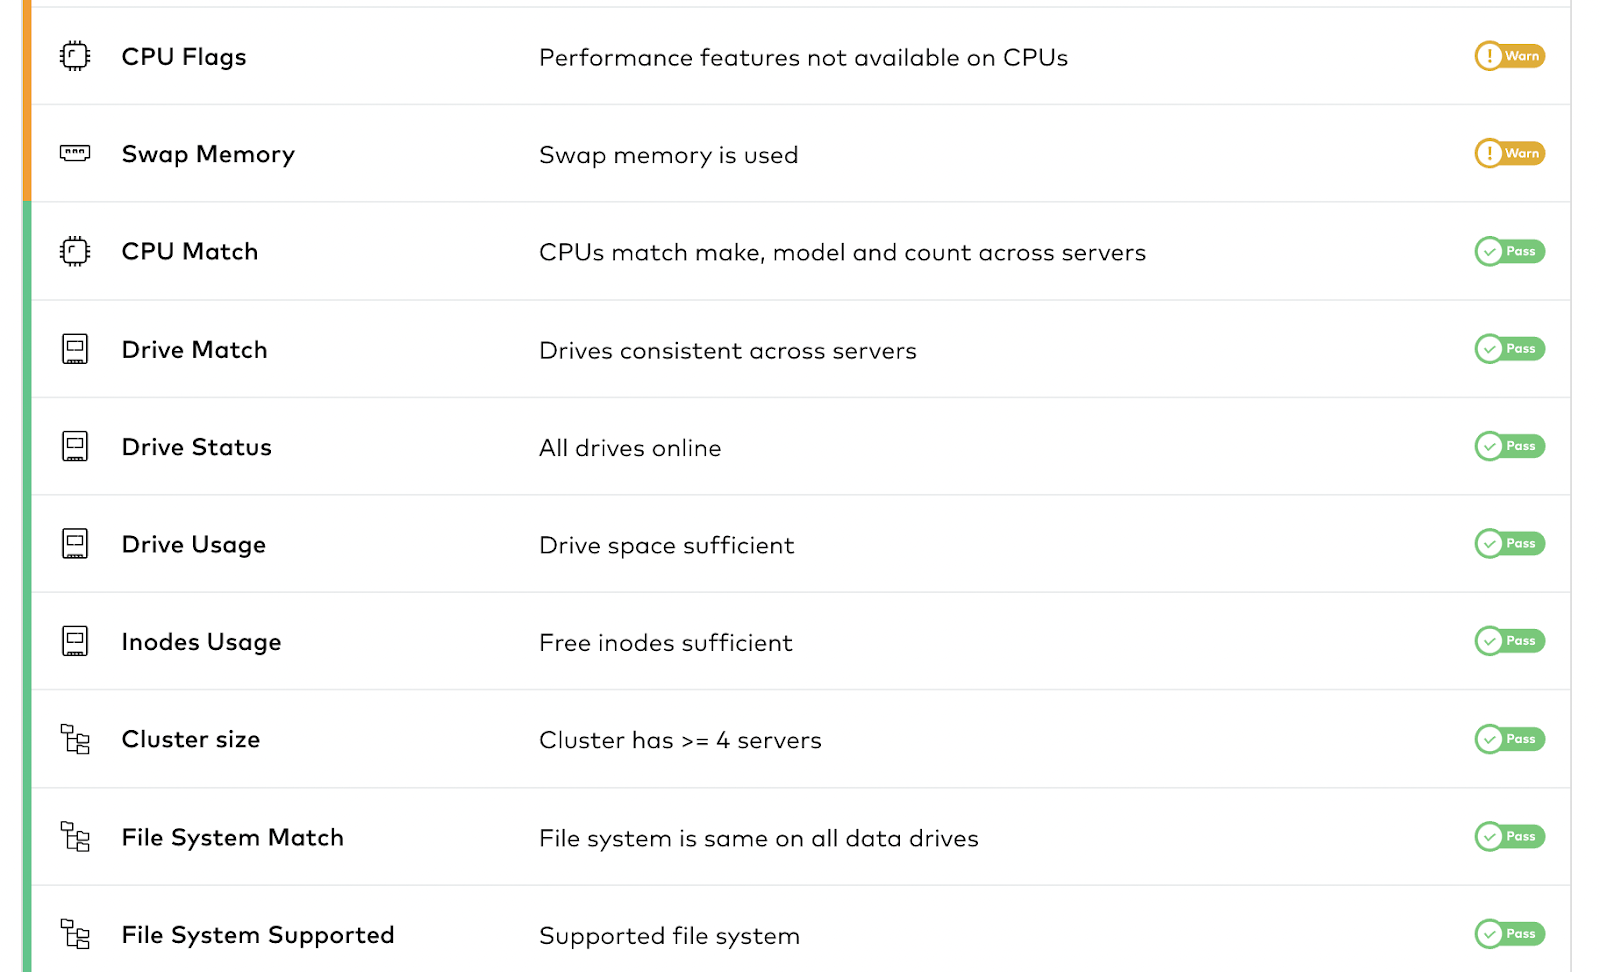
CPUs and Drives Match
Generally CPU make, model and core count should match across the nodes, MinIO recommends this to avoid any performance degradation. This is to ensure there are no bottlenecks at a hardware level. No matter which server MinIO is running on there should be a basic assumption that all the CPU will be the same across server pools for optimal performance.
Drives should also be consistent across servers. Having some servers running SSDs while others run SATA HDD will vastly affect MinIO performance. You will see random bottlenecks in disk I/O and based on the drive where the object is stored the performance will be affected. For example, if the object is stored on one of the nodes with SATA disks, the reads/writes from that disk will be much slower.
Drive Status and Usage
All drives must be online to ensure MinIO has the right number of nodes to distribute erasure coded data with the configured fault tolerance level. One of the common reasons things go awry with customer deployments is that systems reach 0% storage space. As a DevOps engineer you won’t imagine the number of times applications went down when there wasn’t enough storage space.
Inodes Usage
Inodes are used to keep track of the files on the disk. Sometimes there could be enough drive space, but if you have a lot of files that quickly get created and deleted, some of them can linger around, not relinquishing the inode they were assigned. There is a limit to how many inodes a filesystem can have, so having a lot of small files constantly being deleted can cause it to get to this state. Generally, restarting the app that is using those files will cause it to release those inodes.
Cluster size
MinIO recommends a production cluster size of a minimum of 4 servers so that the erasure coding settings have enough parity to distribute the data in case one of the nodes goes down. Although there is an option to add more nodes to the cluster after the cluster is operational, it is far more efficient to plan the cluster with the right size in mind based on the amount of data that you plan to store in the cluster. Operationally and object performance wise - it's recommended to keep the cluster configuration as simple as possible from the get-go.
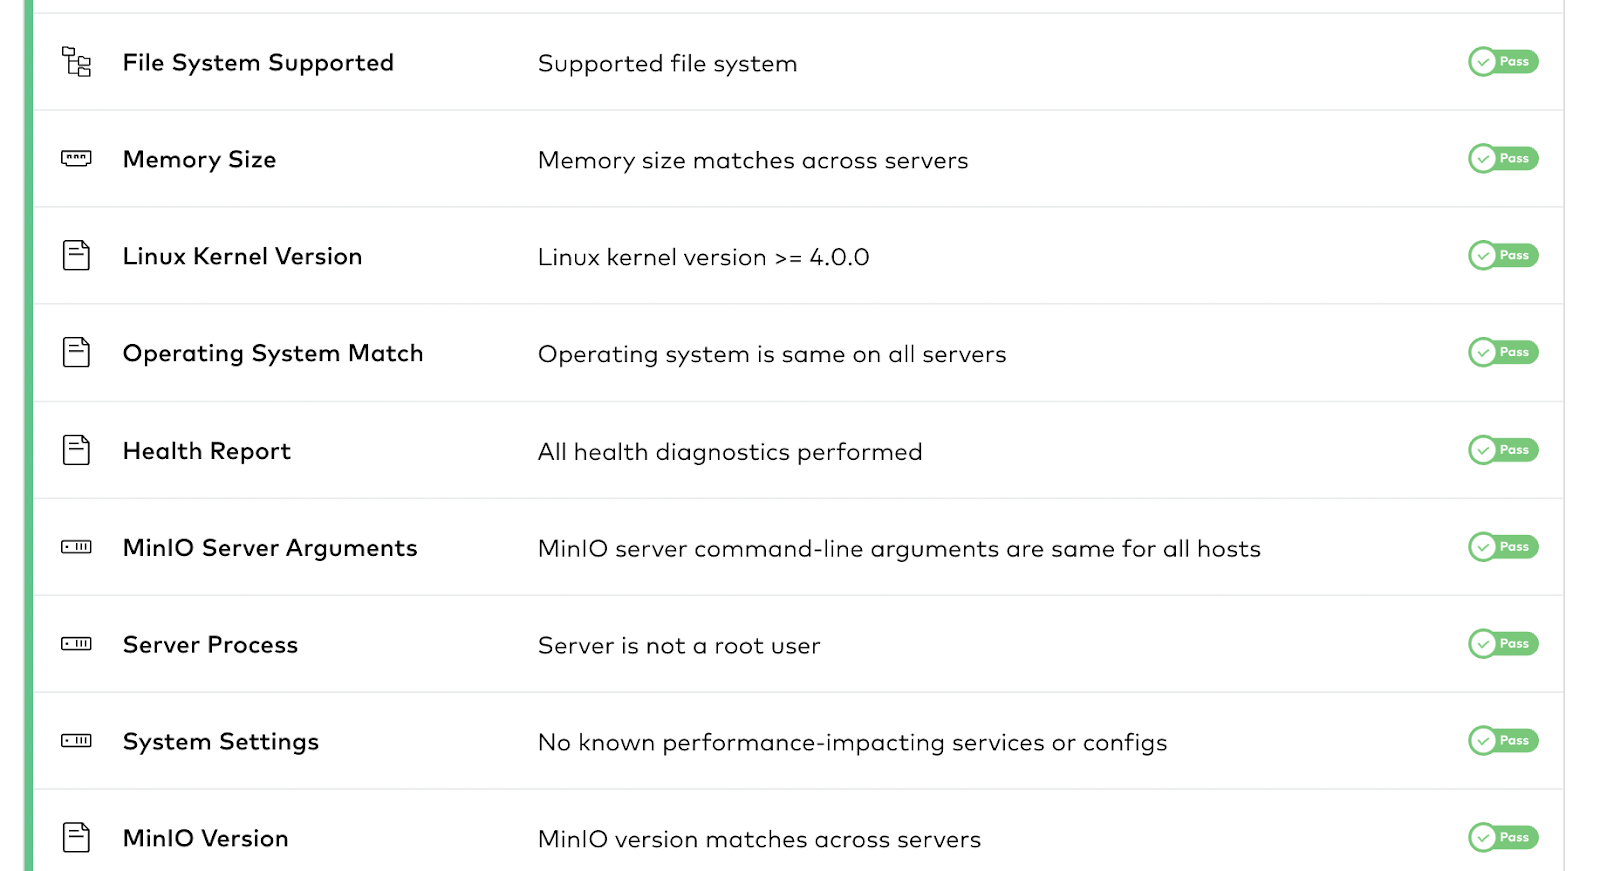
File System Match and Supported
Similar to the other components, MinIO recommends the file system is the same on all data drives as well. At the very least you should use the XFS filesystem and not EXT4 when formatting your drives. This will ensure that performance is also unified across all the nodes. Cluster operators should avoid older file systems such as ext4, and also not use any sort of mechanism that introduces extra durability such as RAID, LVM, ZFS, NFS, GlusterFS etc because MinIO through its erasure code settings will ensure that data is distributed across nodes, so there is no need for another layer as it will cause additional tech debt in managing the infrastructure.
Memory Size
MinIO recommends at least 128GB memory per node for best performance. Ultimately this depends on the number of drives and concurrent requests made to the cluster. Similar to drives, Memory size must also match across all the servers so the configurations are as homogeneous.
Operating System and Linux Kernel Version Match
The operating system must be the same on all servers as recommended by the MinIO hardware checklist. This is to ensure the libraries, file systems, kernel features, are supported equally across all the nodes. By having the operating system on every node match, even the version number, you can ensure that you can seamlessly upgrade MinIO to future versions with minimum intervention. Any Linux kernel older than version 4 is not recommended. Generally, we recommend Linux kernel version >= 5.x to ensure the necessary kernel flags and features are supported.
MinIO Server Arguments
MinIO server command-line arguments must be the same for all hosts. This is where MinIO receives the drive layout and the server layout in the configuration. This is how the other servers in the cluster know how to communicate with each other. So it's important for these to match.
Server Process and System Settings
Generally, you should not run any process as root because if there is any vulnerability, then it can be exploited for full root access. Rather, the MinIO process should only be given access to a particular user for a particular set of operations. This will ensure the MinIO Server is not a root user.
MinIO Version
As we discussed in Best Practices for Updates and Restarts, MinIO versions should match across servers because having inconsistent versions means having inconsistent feature sets. In rare cases it can also be incompatible where you are running different versions of MinIO with different feature sets that can cause edge case issues.
So now for the fun part! How do we get all this helpful diagnostic information sent to SUBNET? Go ahead and run this command.
At the end of the operation, you will receive a link to SUBNET that is only accessible by your team and the MinIO Engineers via the analysis report in the portal.
Logs
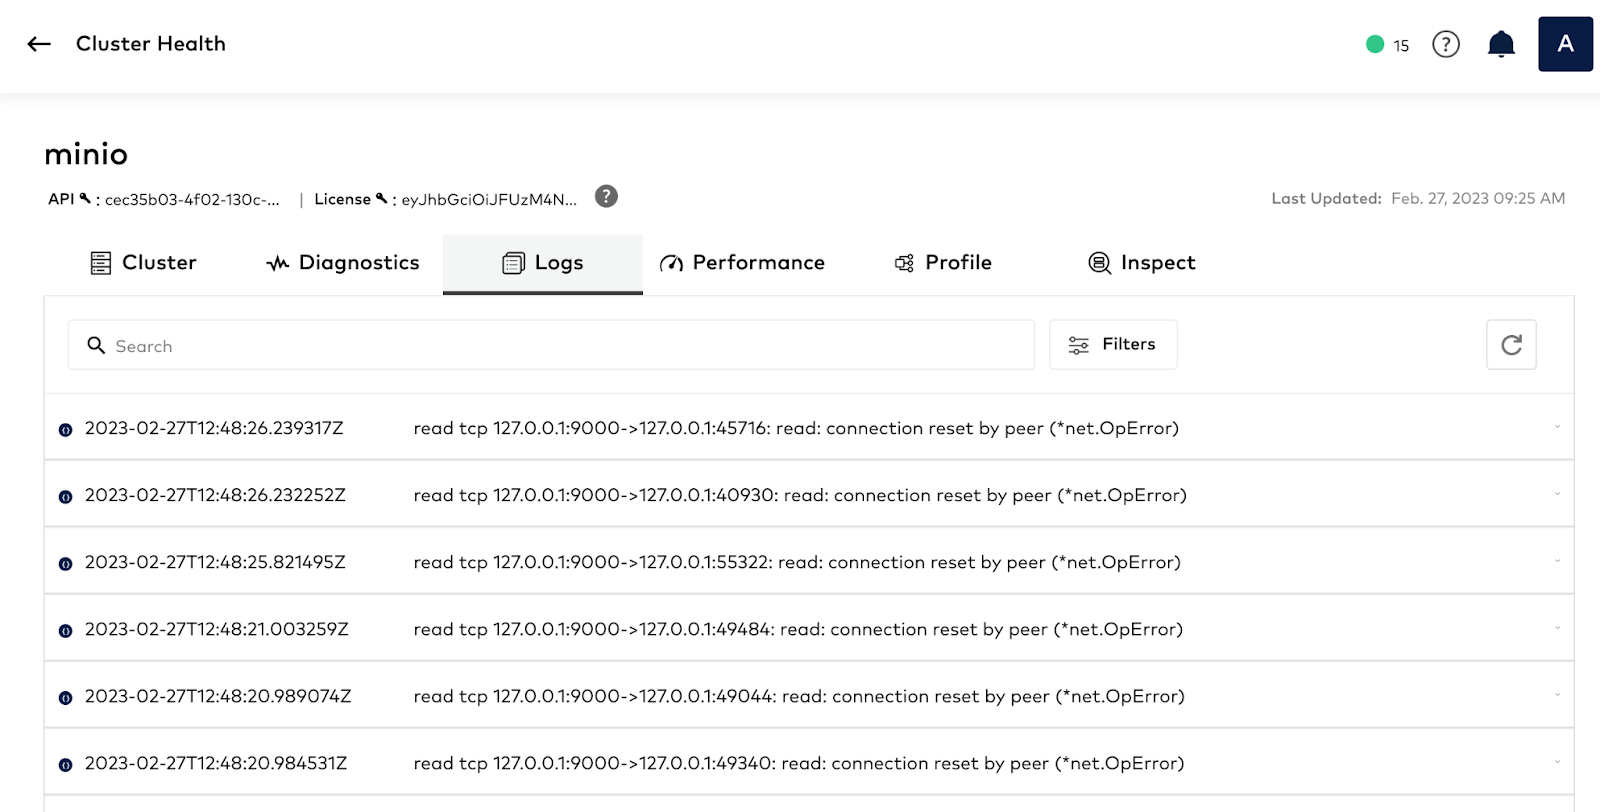
With MinIO you can send logs to multiple destinations for analysis. You can send logs to remote targets, for example a webhook provided by ElasticSearch, and you can also send them directly to the SUBNET support portal – there is no need to manually upload them. By sharing the logs, you give the engineering team from MinIO assisting you on the issue more granular details on the operations of the cluster. You can automate sending logs to SUBNET by enabling call home logs for the cluster using the following command:
Once you enable it, it might take a few minutes for the logs to be sent to the SUBNET portal, give it 30 minutes just to be sure and then refresh to check.
Performance
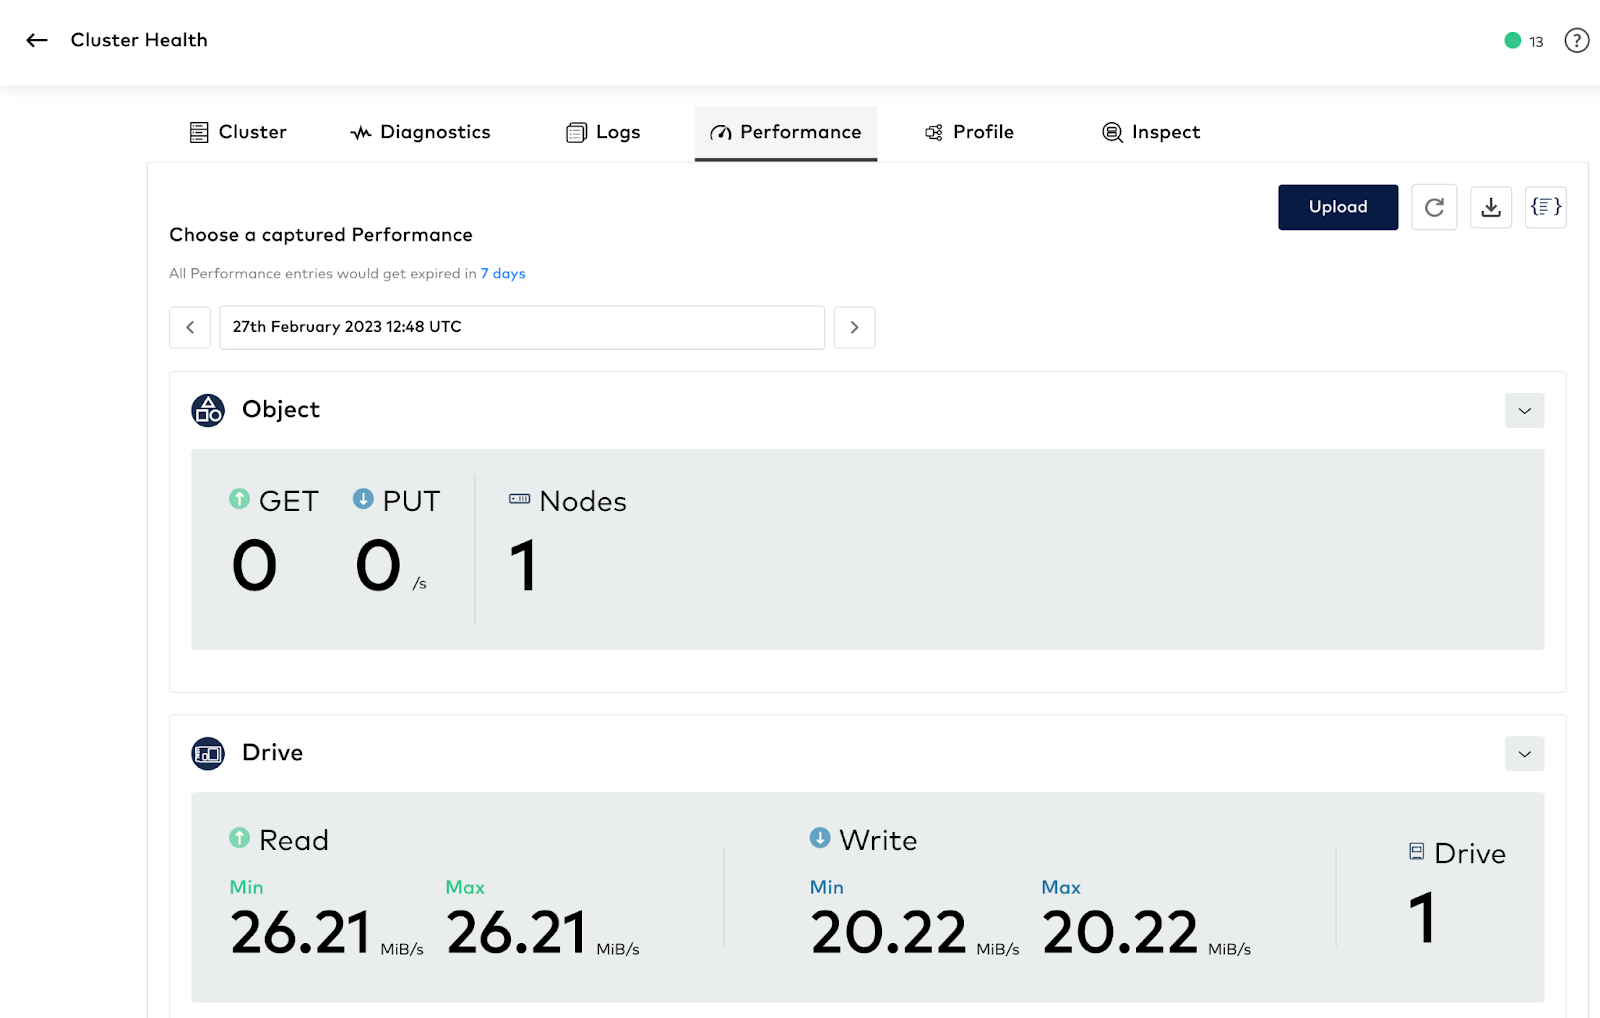
Please run the following command to capture performance details of the cluster. This checks for Network Performance, Drive Performance and also Object Performance. In a previous blog we went into detail on the characteristics of these tests.
In short, Performance tests not only check the disk’s read-write performance, but the test also PUTs and GETs objects within MinIO to test end to end object performance.
In the SUBNET portal, under the Performance tab, you will see the uploaded report you ran in the previous step.
Profile
Linux is built from the ground up with tools for visibility. From how fast the RAM is running on a system to when an application might be stalling out. The problem is there are a lot of tools out there, which is the right tool for profiling? Thankfully the programming language MinIO was written in, GoLang, has one of the best profilers built-in. Gathering these profiles is easy but it does require a bit of know-how about the internals of the software development process. With SUBNET, we made the process of collecting and sending these profiles very easy. The best part is that you don’t need to know how to interpret these, the MinIO engineering team will happily take a look at these profiles and interpret it for you.
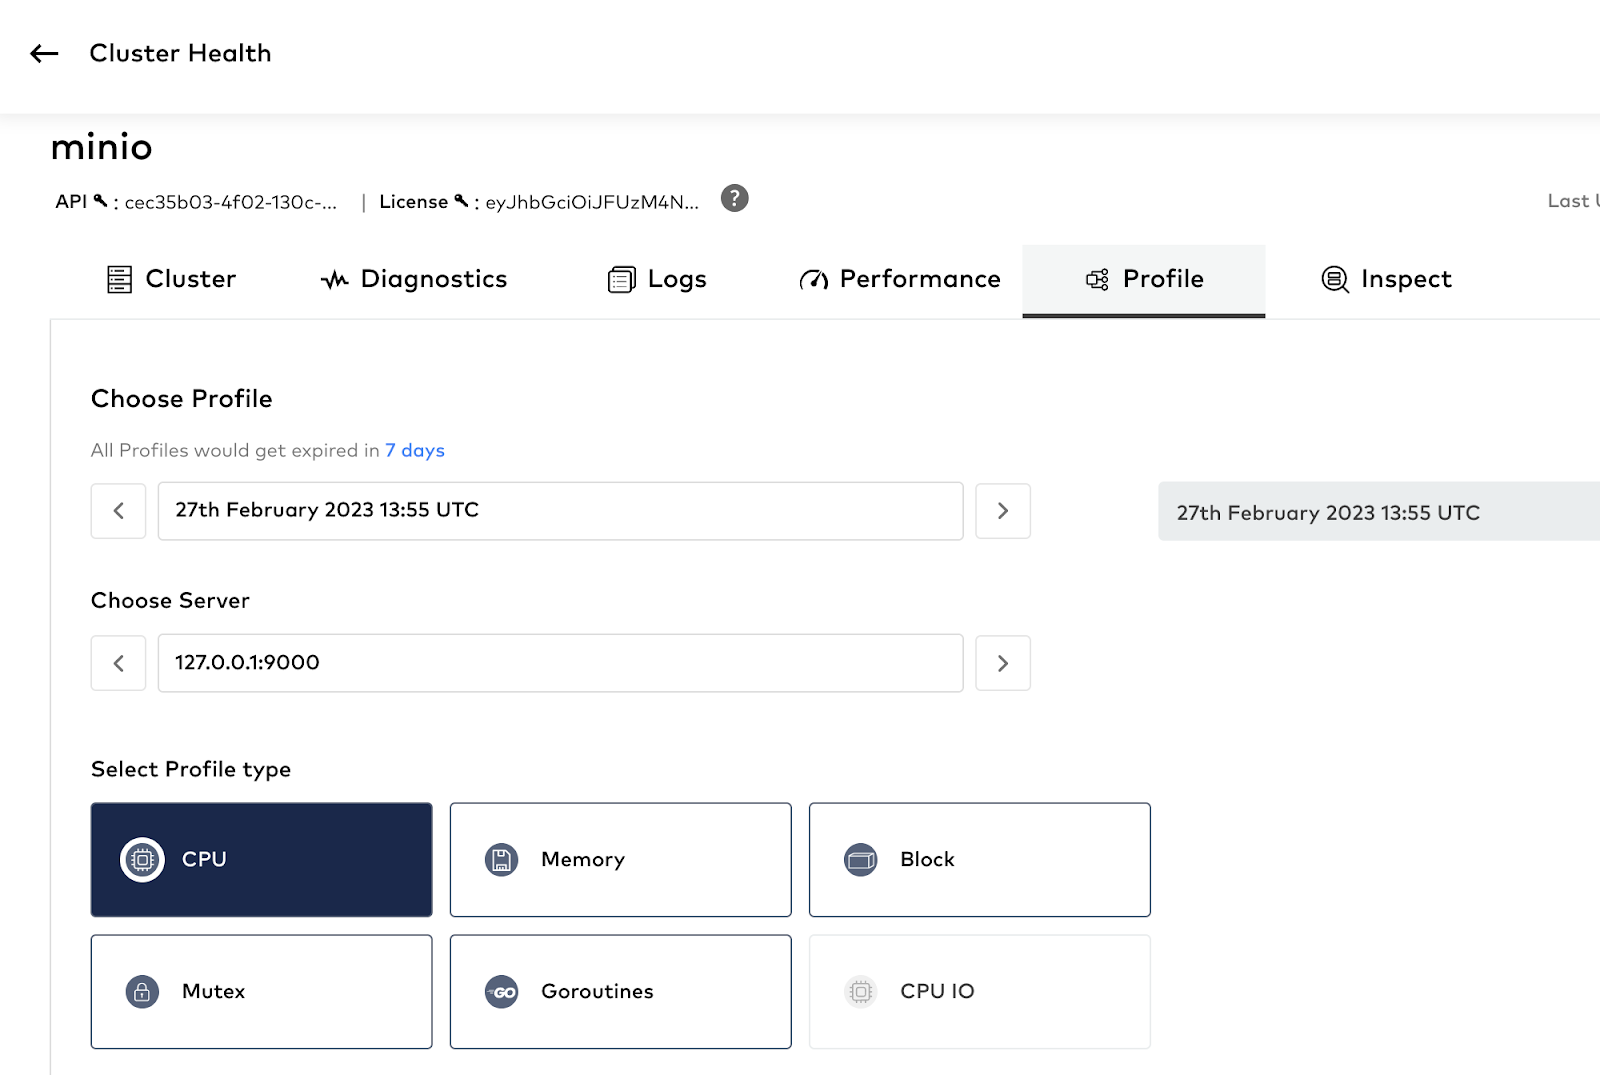
You can run MinIO’s profiling tool for just 10 seconds and get all the information available for you to see and share with us on SUBNET.
Under the profile type, you can not only see the various profile types such as CPU, Memory, Block etc., but also their results by clicking on them.
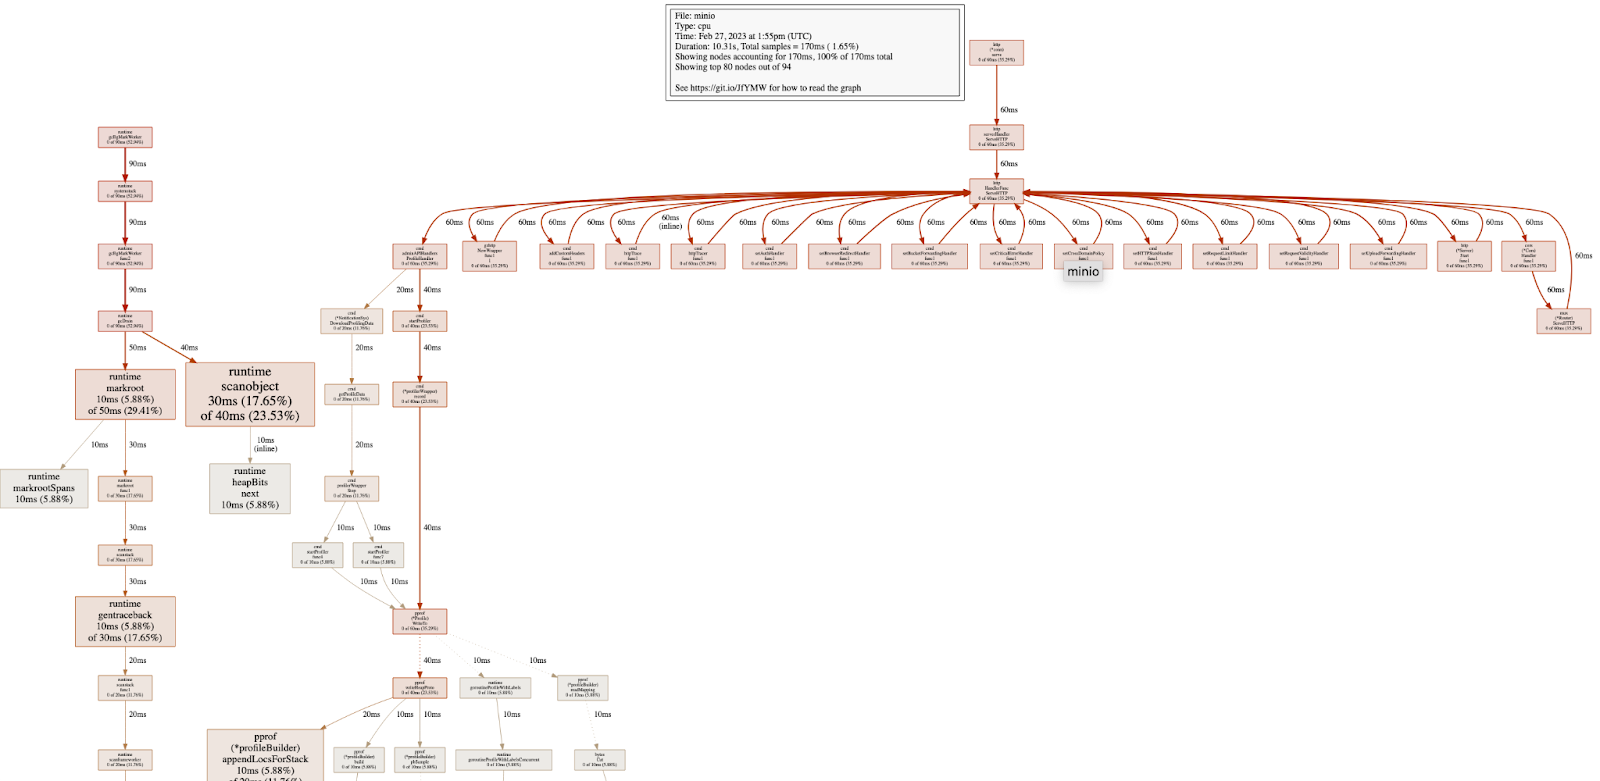
Below is an example of the CPU profile. If you click on the other boxes you should see the other profiles too. Here you can check all sorts of details, but most importantly it lets MinIO engineers who wrote the code see exactly what is happening and where to target bottlenecks in CPU or in the GO runtime itself.
Inspect
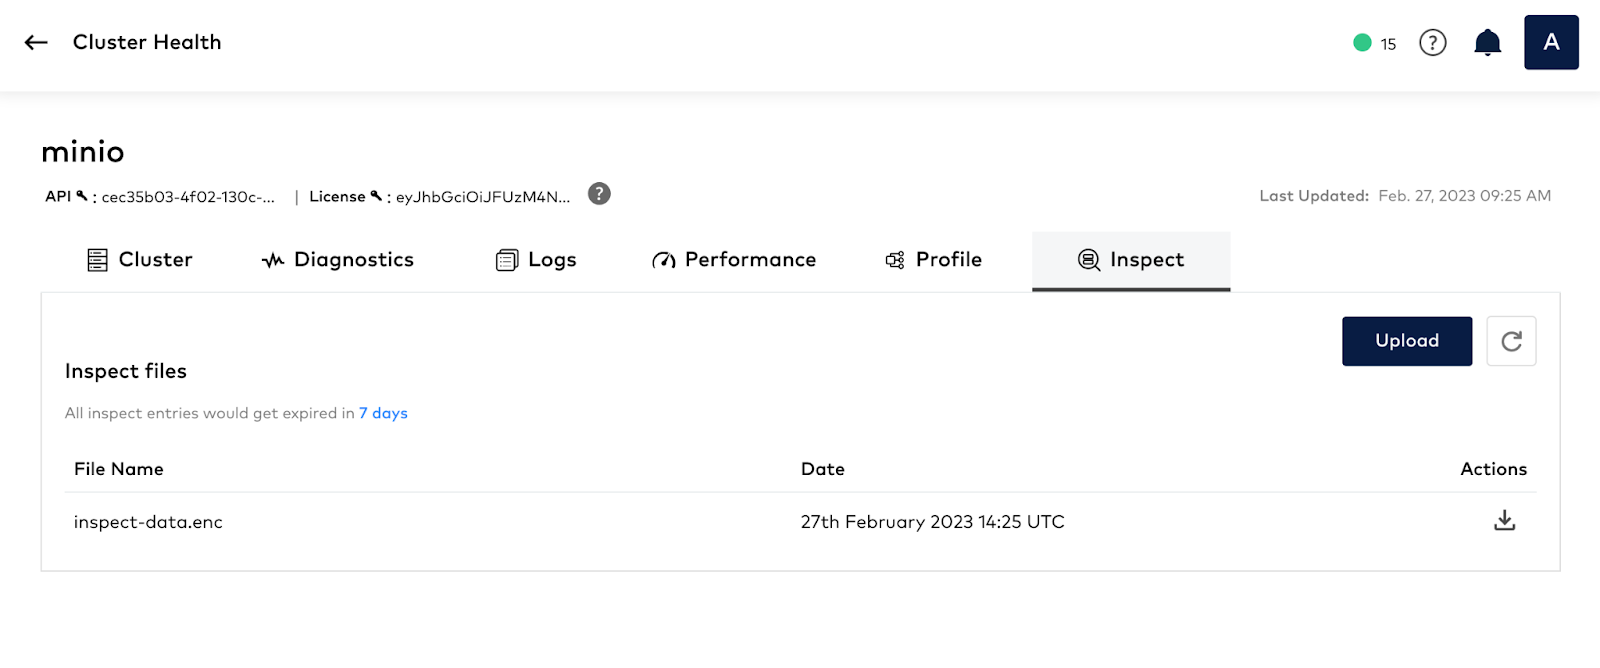
The inspect command collects the data and metadata of the objects associated with a specific path. The data is assembled from each of the backend drives storing the shard. This command will upload the results to the Inspect tab.
Please run the following command to inspect
Final Words
In this post we went into as much detail as possible of what is involved in a HealthCheck. We showed you the different components of the diagnostics, how logs can be piped from the cluster, running network/drive/object performance tests, along with profiling and inspecting objects and clusters. With the Enterprise License you will be able to use the `mc support` command to send this information once or periodically – it’s up to you. You can also upload this information manually to the SUBNET portal after running the same commands in airgap mode. In this exercise we showed you how to do this automatically and push results directly from the cluster.
If you would like to know more about running HealthChecks, or would like to enable it, give us a ping on Slack and we’ll get you going!


