Powerful Perspective: Introducing MinIO Enterprise Object Store Observability

The observability revolution powered huge advancements in computing, security, infrastructure and auditability. Enterprise observability provides comprehensive and granular visibility into cloud-native systems to identify and resolve issues faster. Telemetry data – metrics, logs, traces, health checks – can be displayed and correlated in real time - providing context across the organization from the c-suite to the security teams.
There are some superb solutions on the market but they have one underlying weakness – they are, for the most part, generic in nature. What the market lacked, and what we have built, is an observability solution designed expressly for large-scale object storage deployments. MinIO Enterprise Object Store Observability feature provides a fresh and comprehensive troubleshooting tool to ensure functionality and performance across all of your data pipelines. This perspective simplifies and streamlines MinIO operations and troubleshooting and is a complete monitoring solution purpose-built for MinIO, including metrics, logs, tracing, and comprehensive audit logs, and much more. It is available at the commercial tier Enterprise Lite and Enterprise Plus offerings.
MinIO has always had observability, relying on plugins to connect to all the industry standard observability solutions. We support all of the leading solutions through industry-standard APIs. For example, we've always had a Prometheus API endpoint to serve metrics and various Grafana dashboards to visualize them. We'll continue to support these tools, but we can do better for our customers. We understand how MinIO works, the data it generates, such as logs and metrics, and how to visualize them.
Several years ago when you had a monolithic application, it was fairly easy to debug and diagnose since there was probably only one service with a couple of users. Nowadays systems are broken up into smaller microservices deployed in containers on top of Kubernetes in multiple clusters across different cloud environments. In these kinds of distributed environments, there is a need to observe it all, both the overall picture and, if need be, at a more granular level.
MinIO’s Enterprise Observability can be divided roughly into three sub-categories: logging, metrics and tracing. In this blog post, we’ll show you how simple it is to get set up with these components in your new or existing MinIO application.
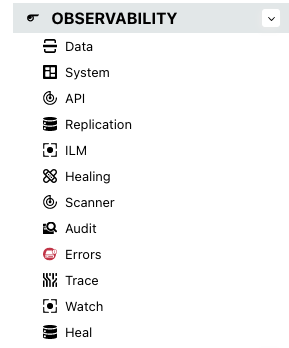
Let’s take a peek by going through each of the menu items and explaining why we did it and why it is important:
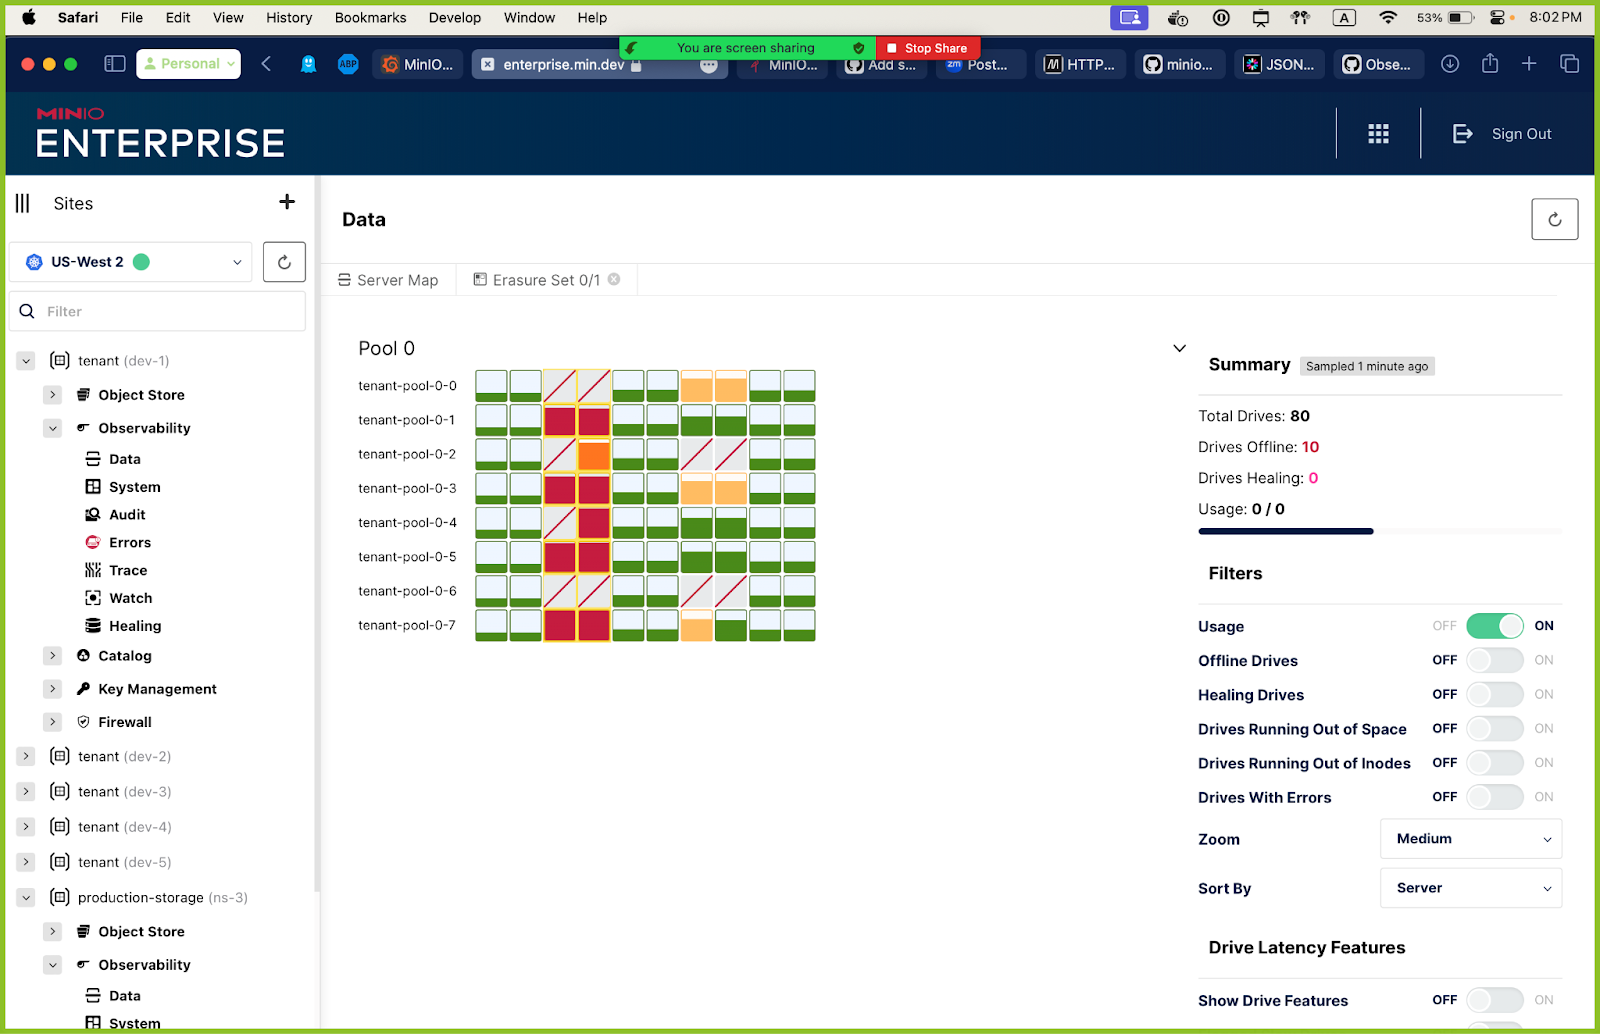
Data Map
The Data Map metrics allow us to peer into any set of drives, even down to the erasure code level – breaking out drive utilization, capacity and performance. The below screenshot shows the amount of data used and available. Importantly, it shows the number of drives that are either offline or in a healing state, which you can easily check to ensure the cluster can still serve requests while the infrastructure is being healed.
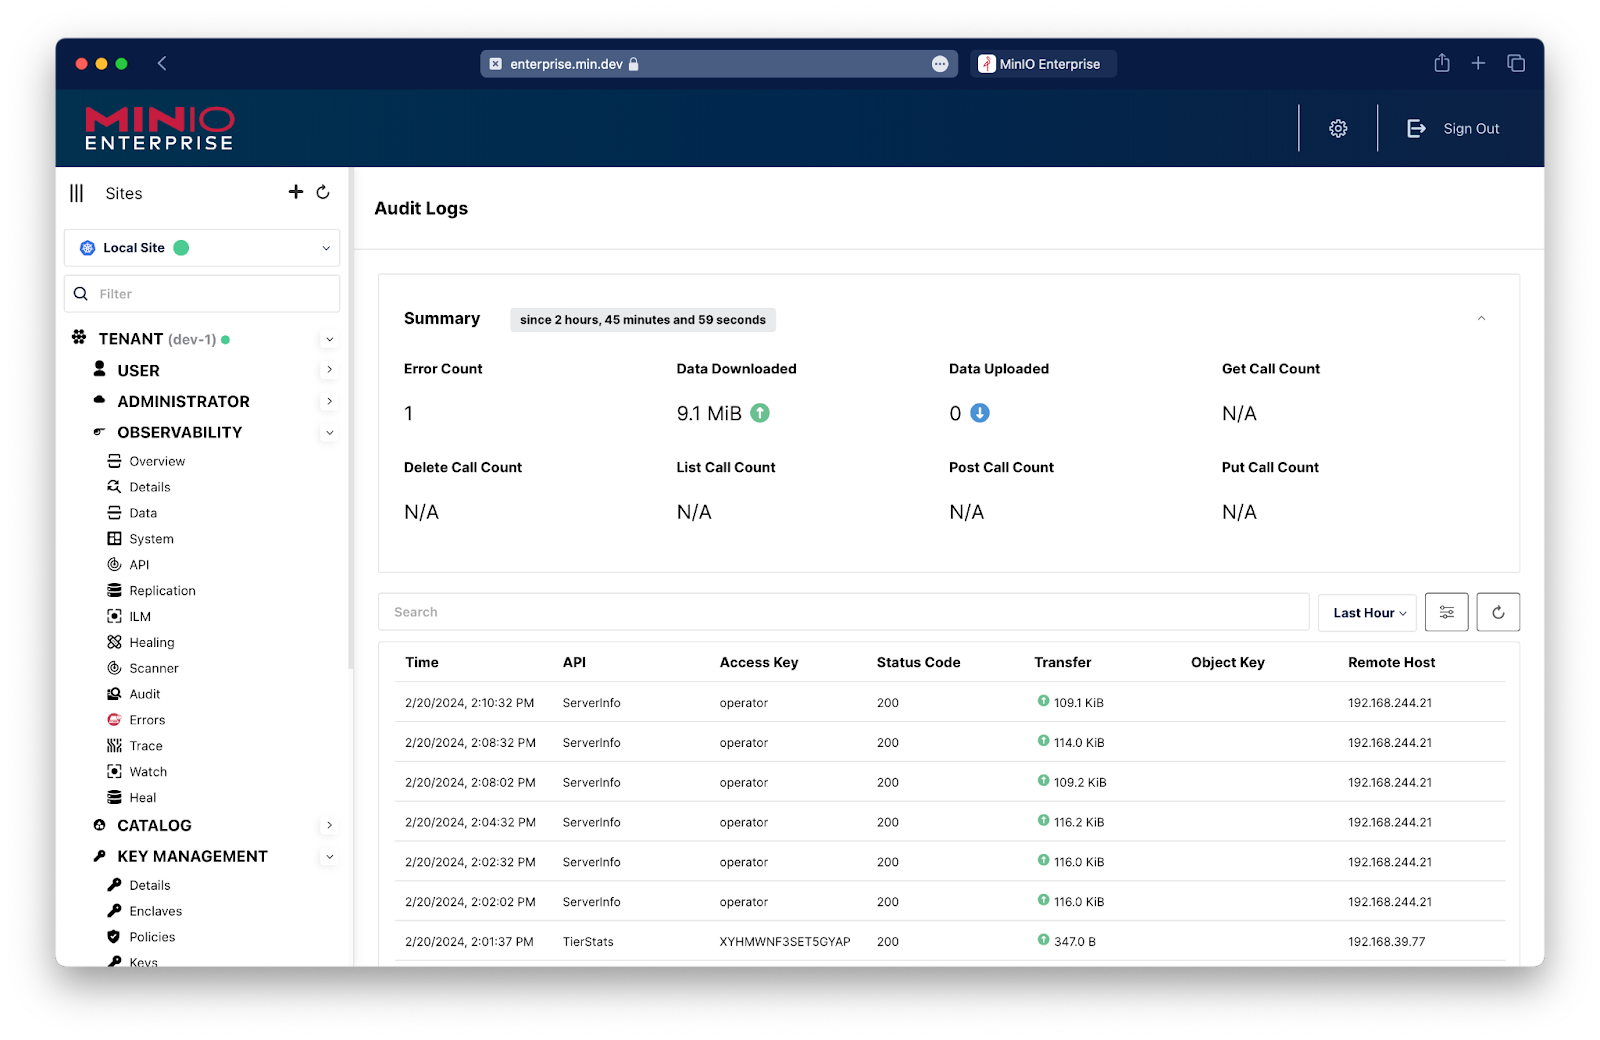
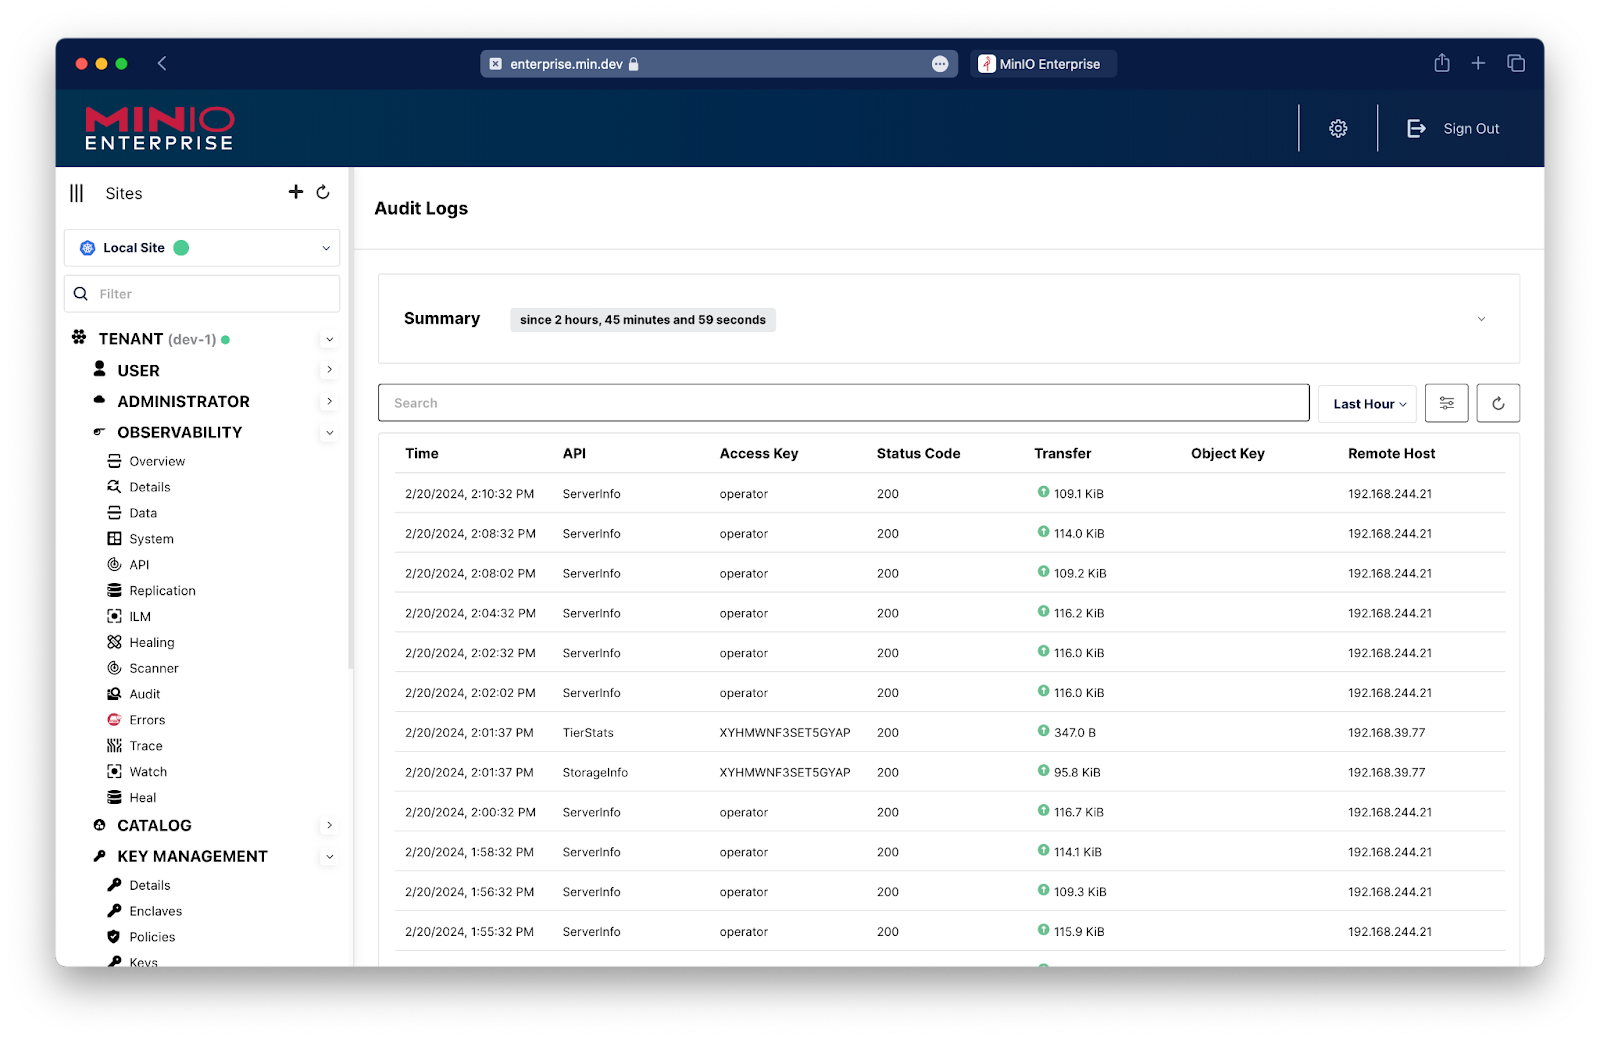
Audit
The Audit Log captures all the system calls and system activity along with all the user activity. It also captures other usage such as for the system and for the users. It becomes important to know what changes were made to the overall cluster and what was uploaded to the network, among other activities. The Audit log is where all this information resides.
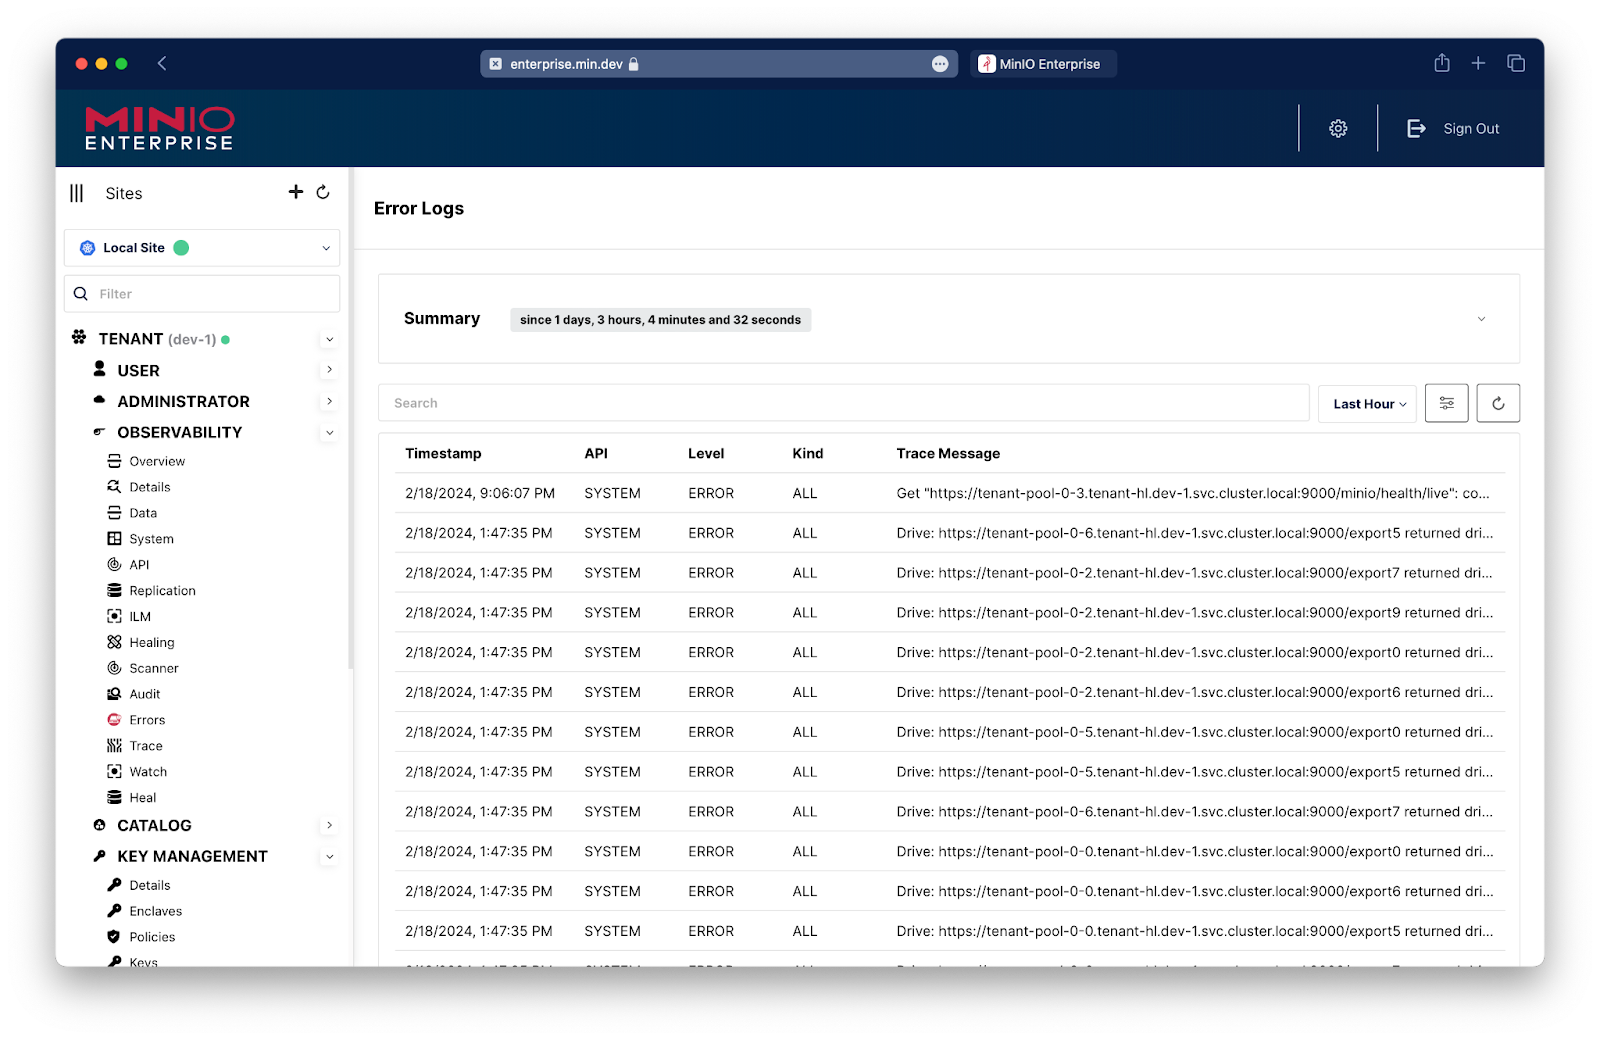
Errors
Error logs show problems with internal processes. Failing drives or drives that are about to go offline are two examples. It also logs other high-level problems such as those with lambda notification or replication. Error logs show problems with drives that cannot connect and drives that have random read problems. These issues are fairly rare but when they do happen we can capture and surface them in a digestible manner.
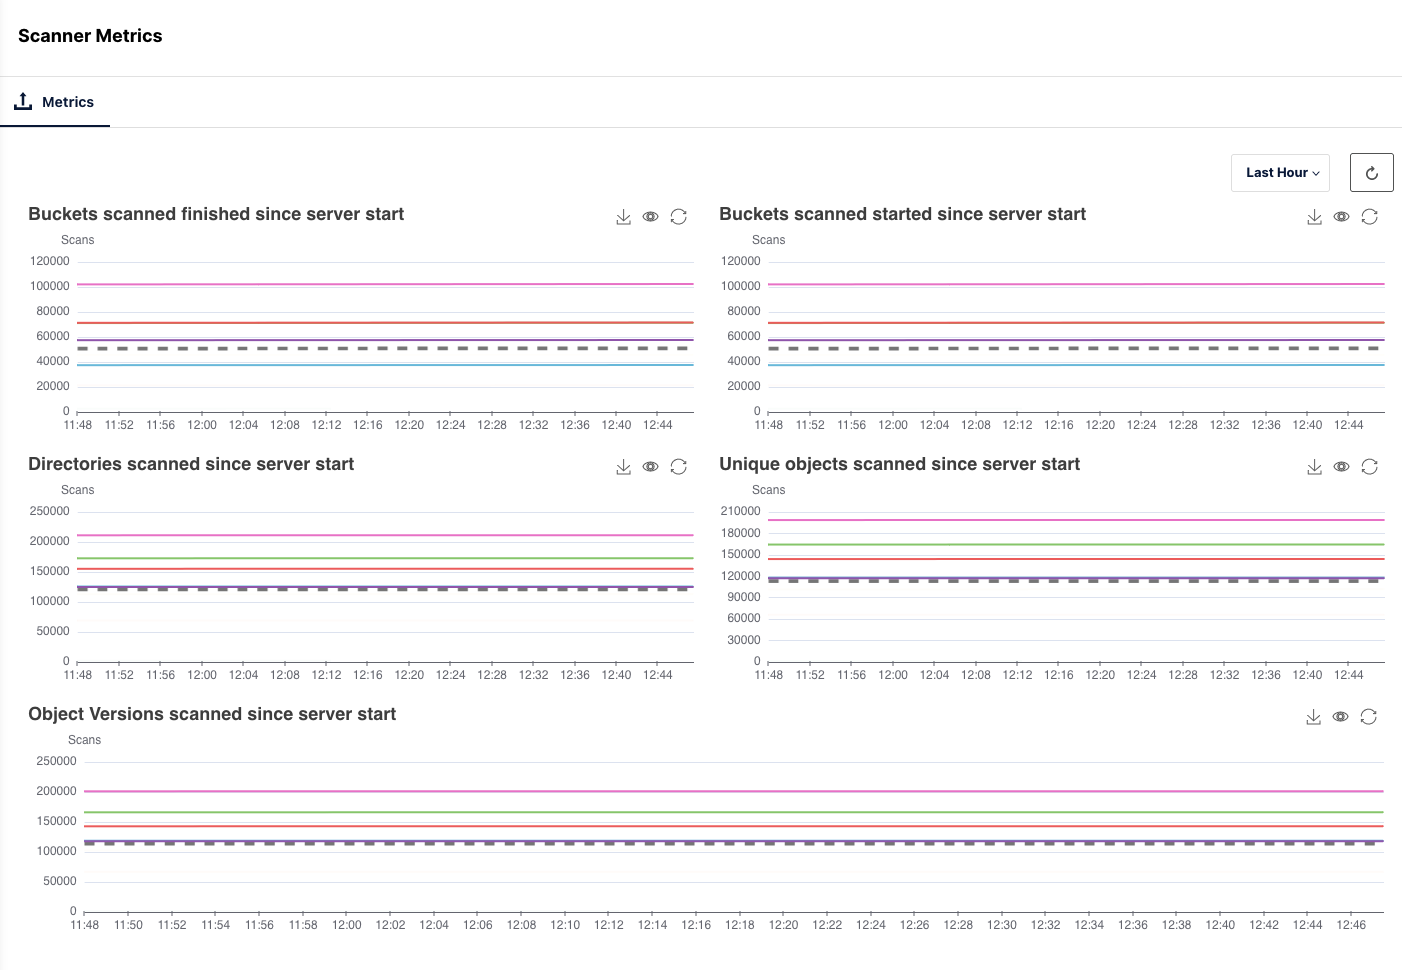
Metrics
There are several Application Metrics graphs and gauges available to monitor at the hardware component level for Scanner, Healing and ILM. Some of the available metrics are:
- Buckets scanned finished since start
- Buckets scanned started since server start
- Objects healed in current self healing run
- Objects canned in current self healing run
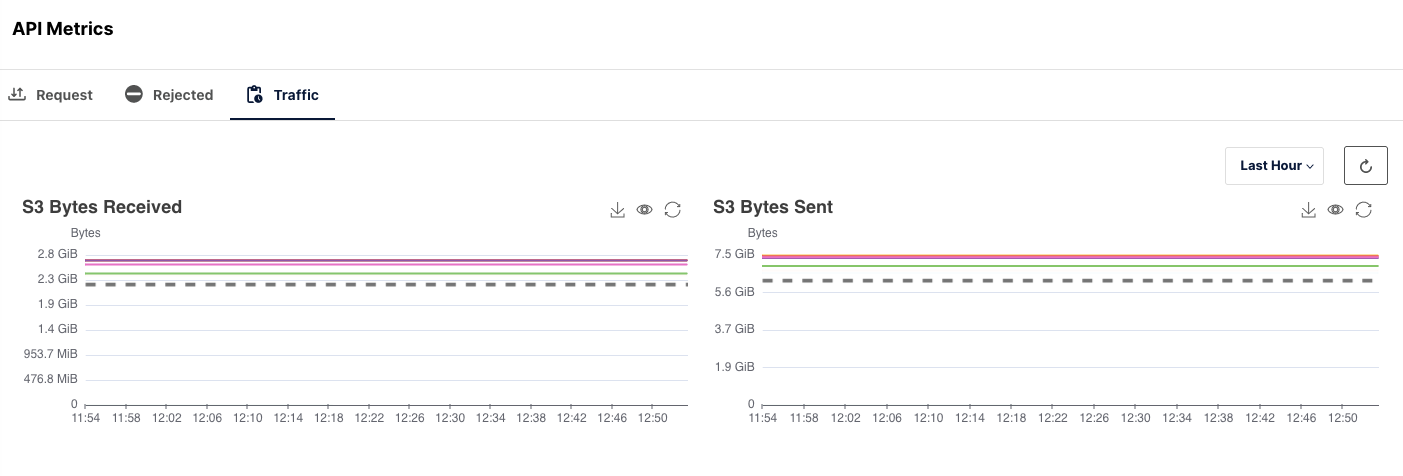
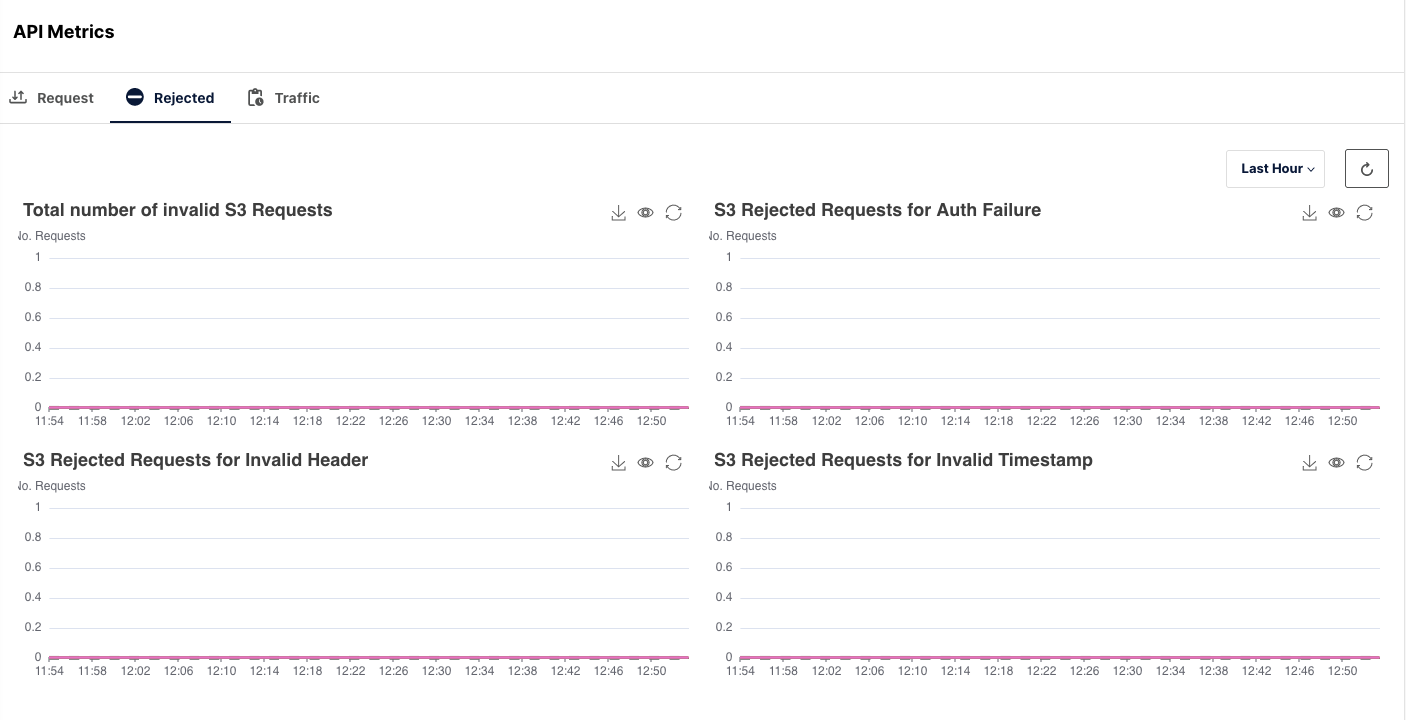
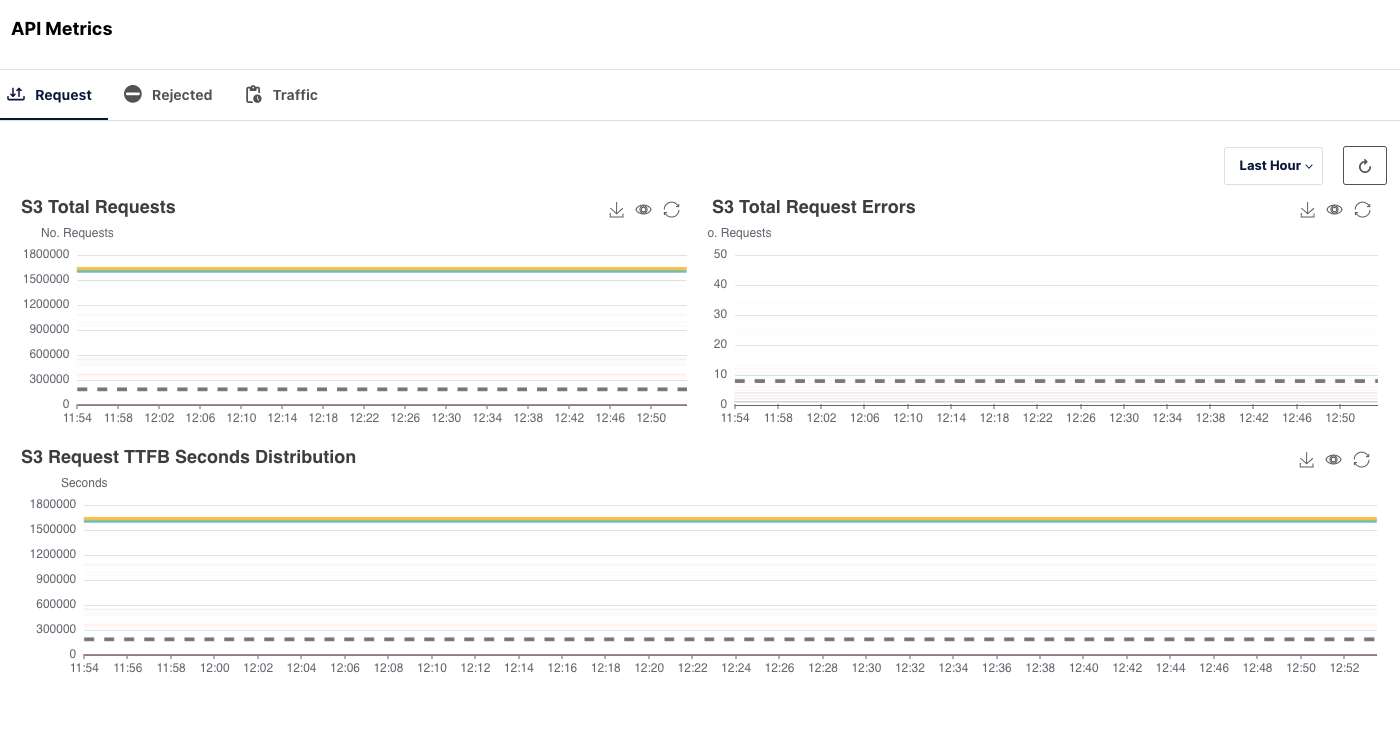
API
The majority of the traffic will happen through the S3 API Metrics. Therefore, it is necessary to monitor the rate of Requests made, Requests Rejected and the overall traffic flow when accessing the MinIO cluster.
API is one of the most important aspects. This gives you an overview of how the data is being accessed and the overall access to the data. How many reads and writes you get per minute, if there is a lag in requests even in milliseconds, that can be surfaced. The API metrics can even be added to a radiator type dashboard to view it up to date.
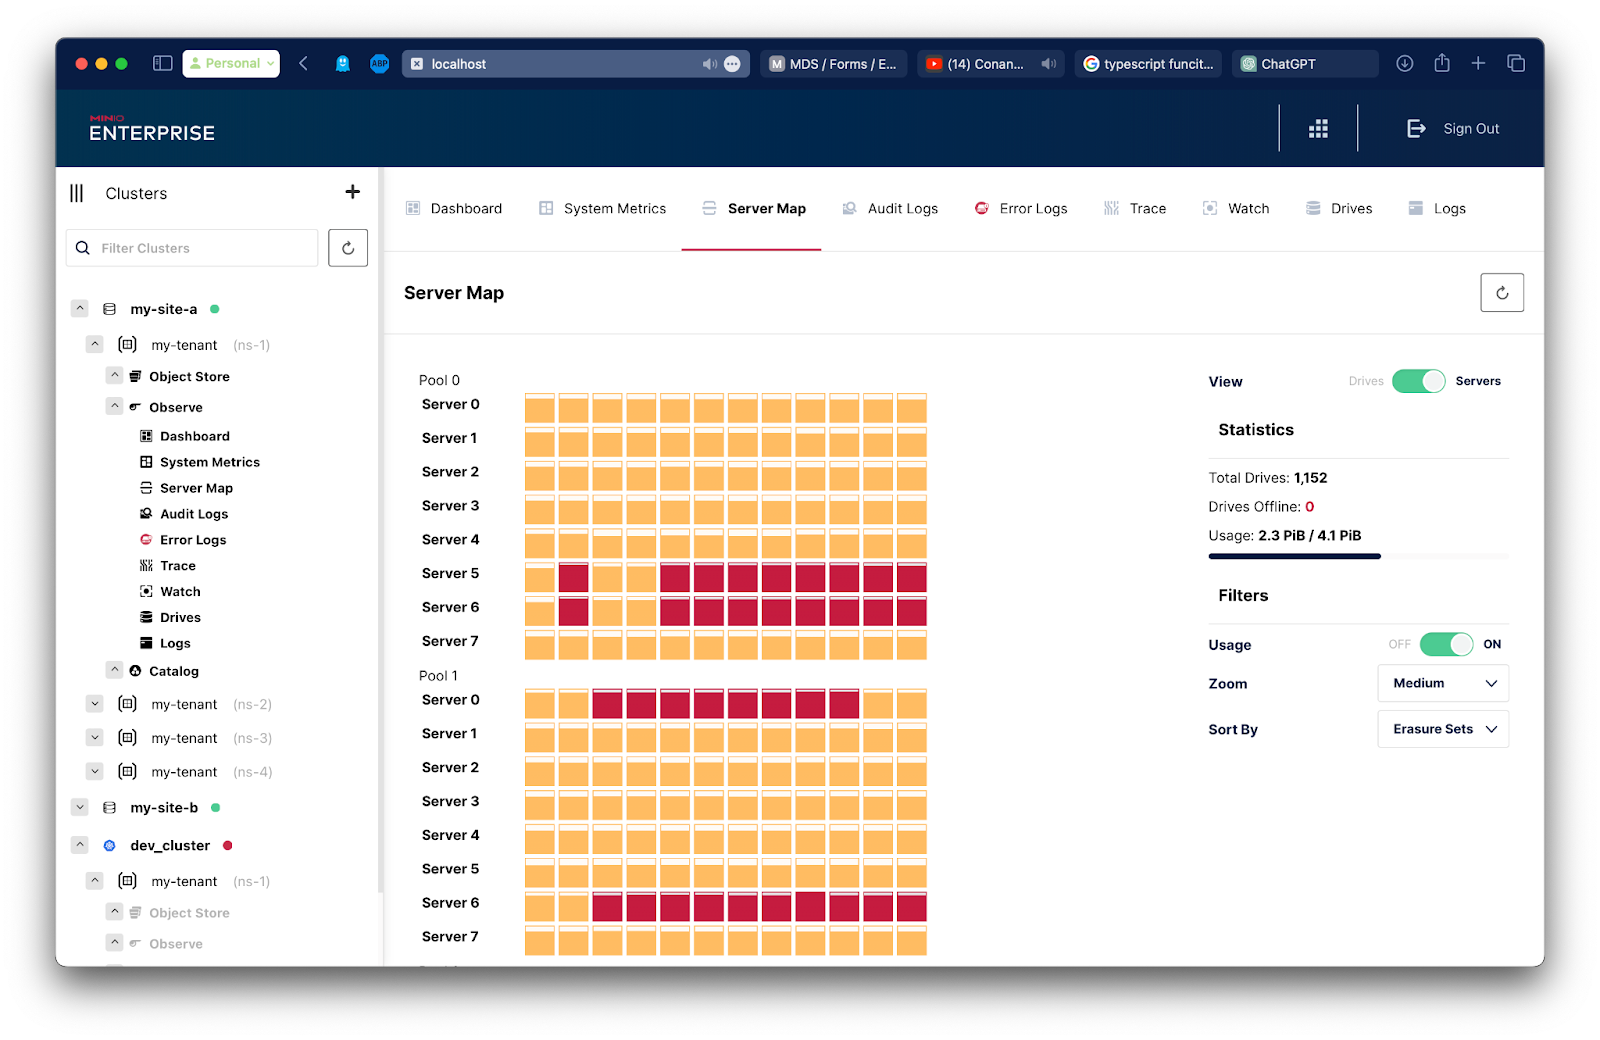
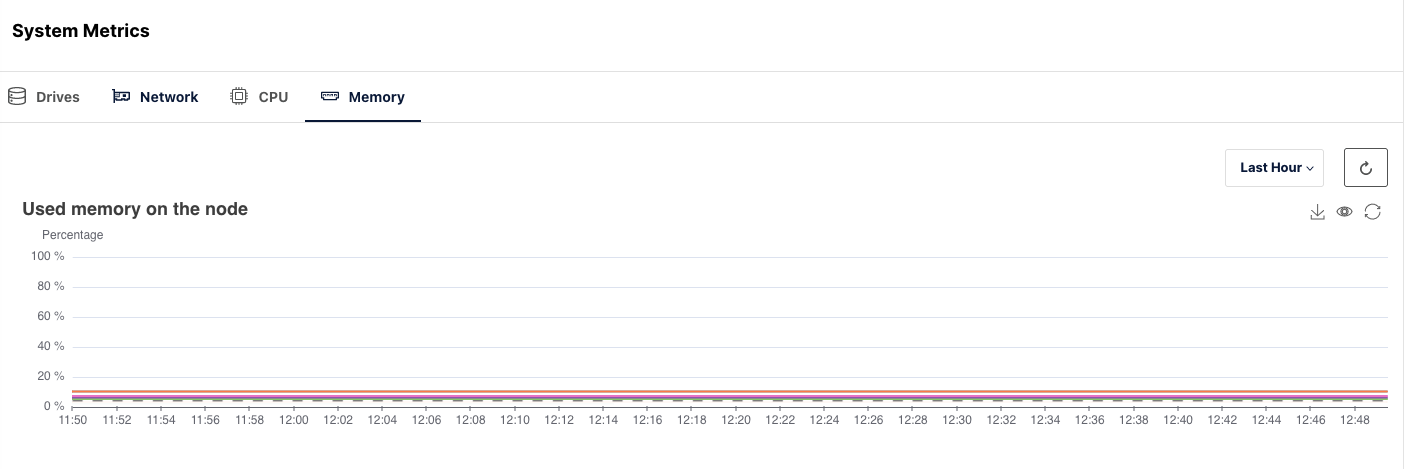
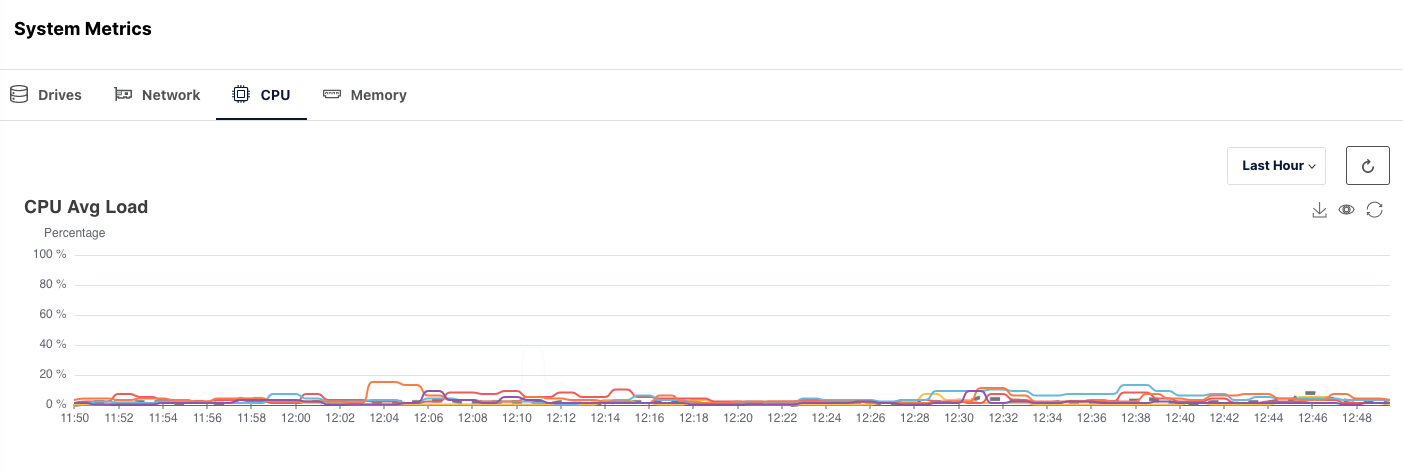
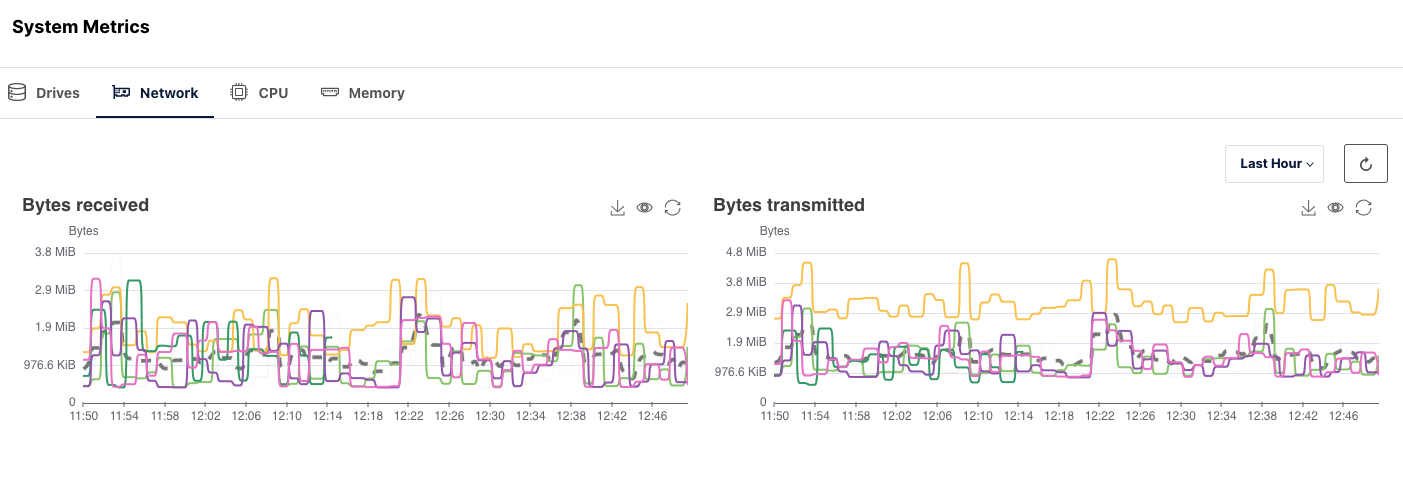
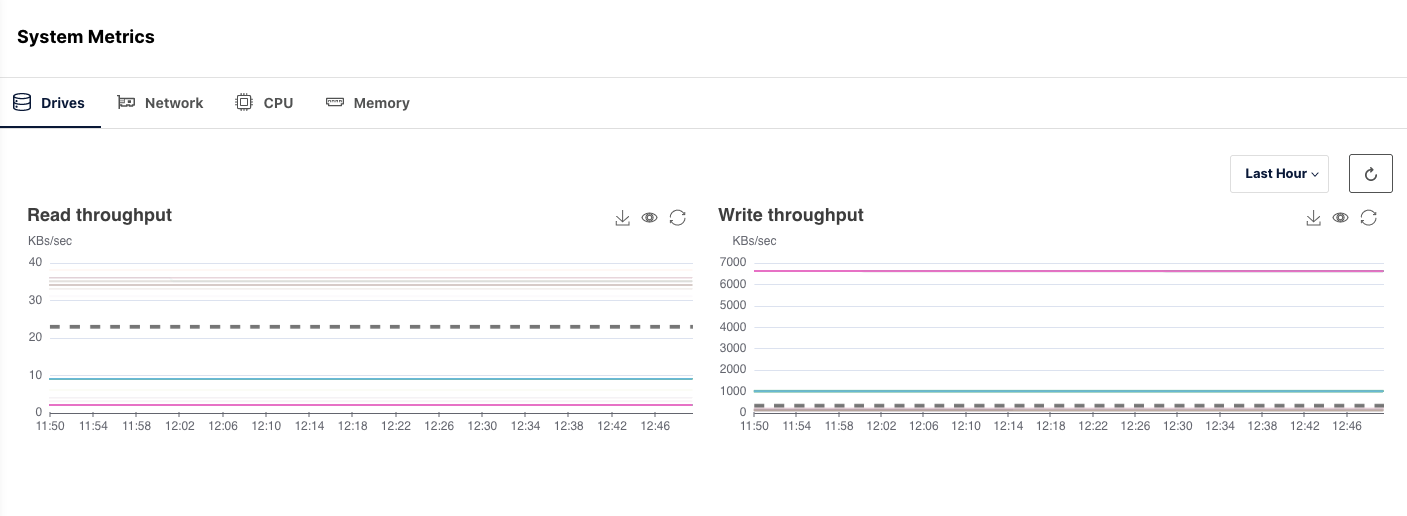
System
There are two major hardware-related components on which MinIO heavily relies and is therefore highly attentive to: drives and networks. While drive performance might be the more obvious concern given that data is stored on physical mediums, it's crucial to acknowledge the significant role networks play in overall performance, especially in distributed environments. While the asynchronous nature of default replication might allow you to set it and forget it, you also need to know if the cluster is falling behind on its replication of data. Monitoring these systems, along with proper CPU and healthy amounts of memory is important.
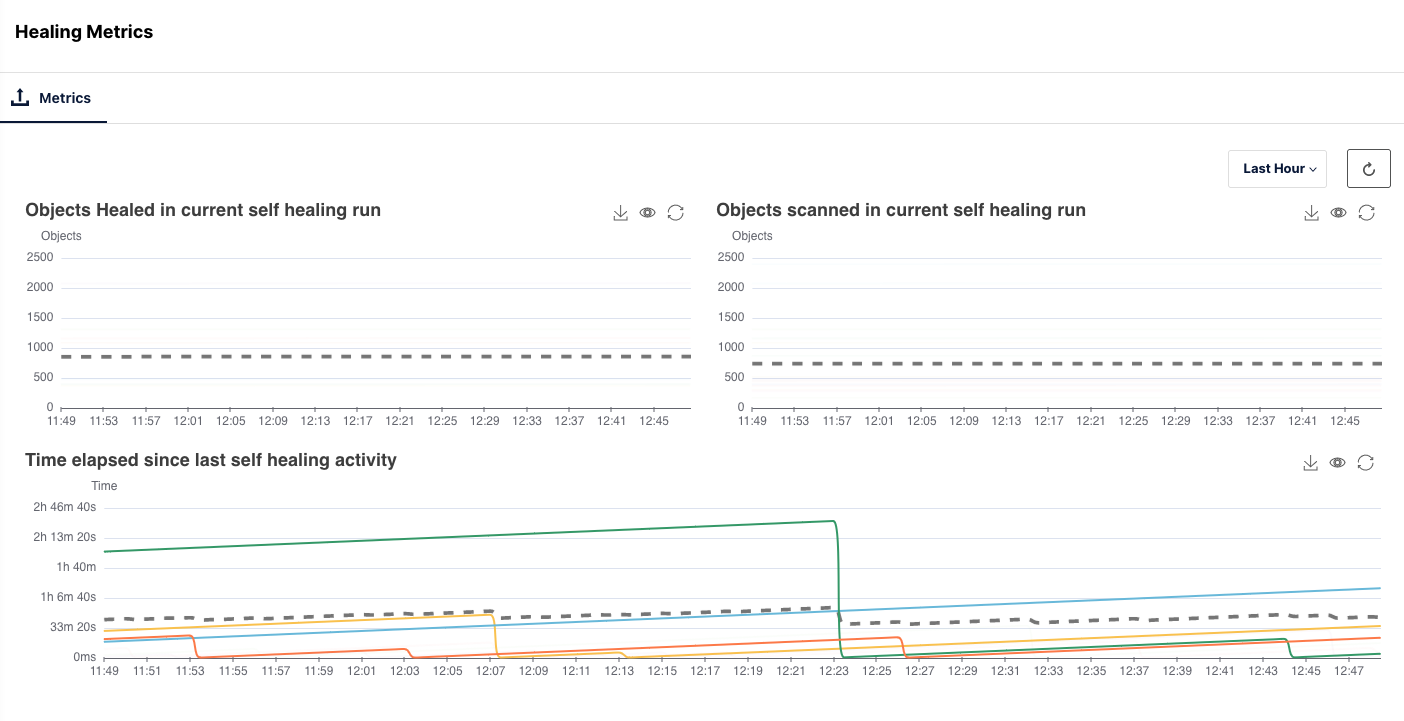
Healing
MinIO automatically heals objects damaged by silent bit rot corruption, drive failure, drive replacement, or other issues on PUT/GET. MinIO also performs periodic background object healing. In the graphs below you can see the objects scanned and healed during the self healing runs. Healing automatically heals subjects damaged by drive corruption, drive failure and other hardware failure. You can view the service state using the graphs for the objects scattered during the self healing runs.
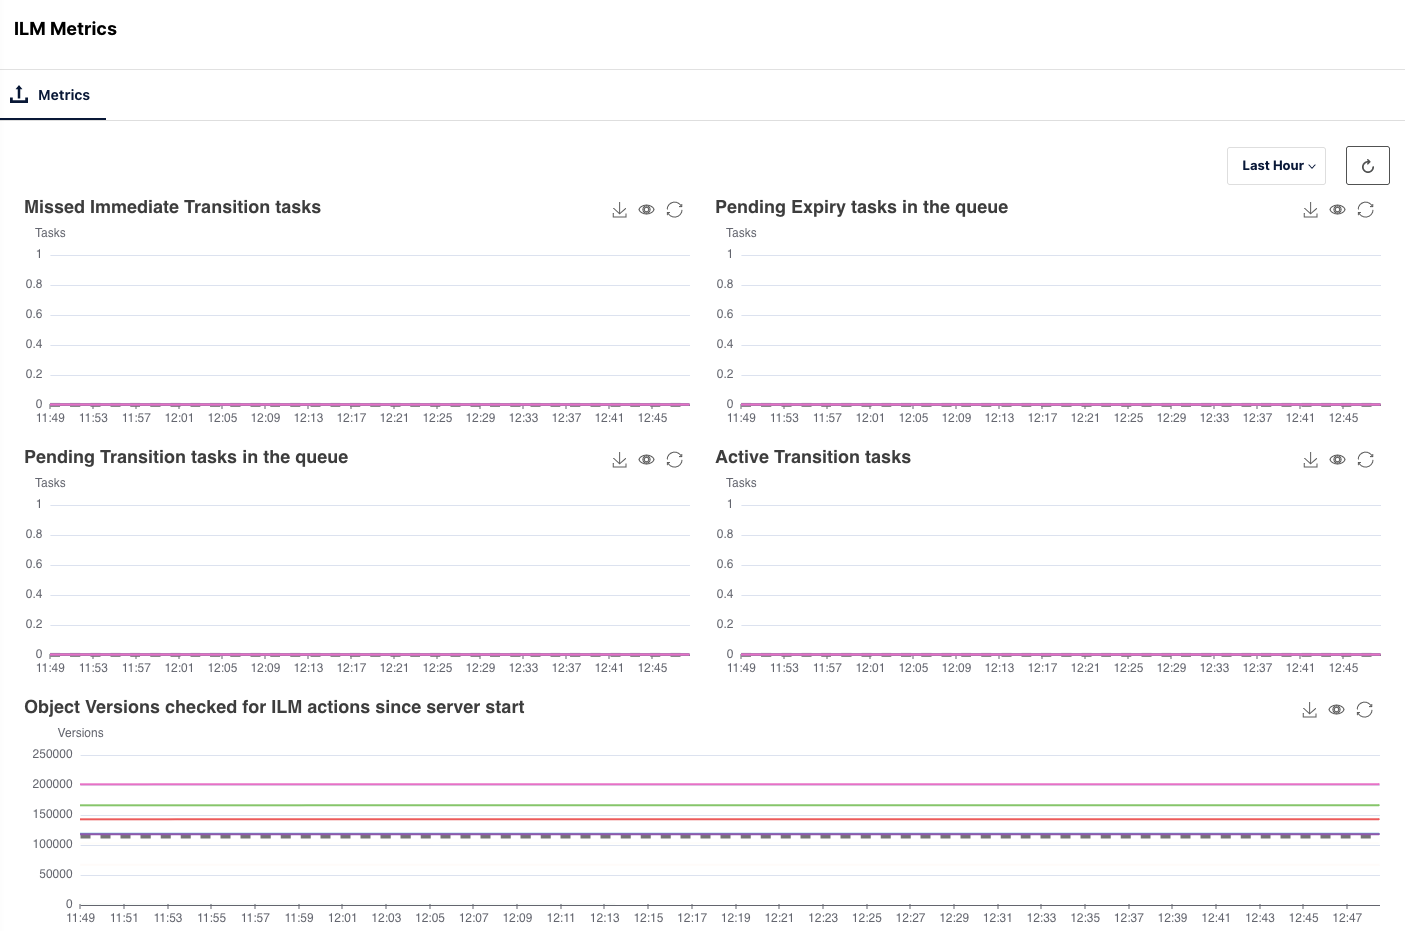
Lifecycle Management
Lifecycle management data brings visibility into patterns and alerts into your enterprise. This helps you run further analysis. For example, if you want to check for certain trends this year, you can get the report by graphing lifecycle management. Lifecycle management is all about the rules regarding transitioning data or deleting data. Our recommendation is to make a separate, “never delete” application there, and use lifecycle management for that. So if you want to be able to monitor what's going on with the lifecycle management rules that you have in your system this is the place to go.
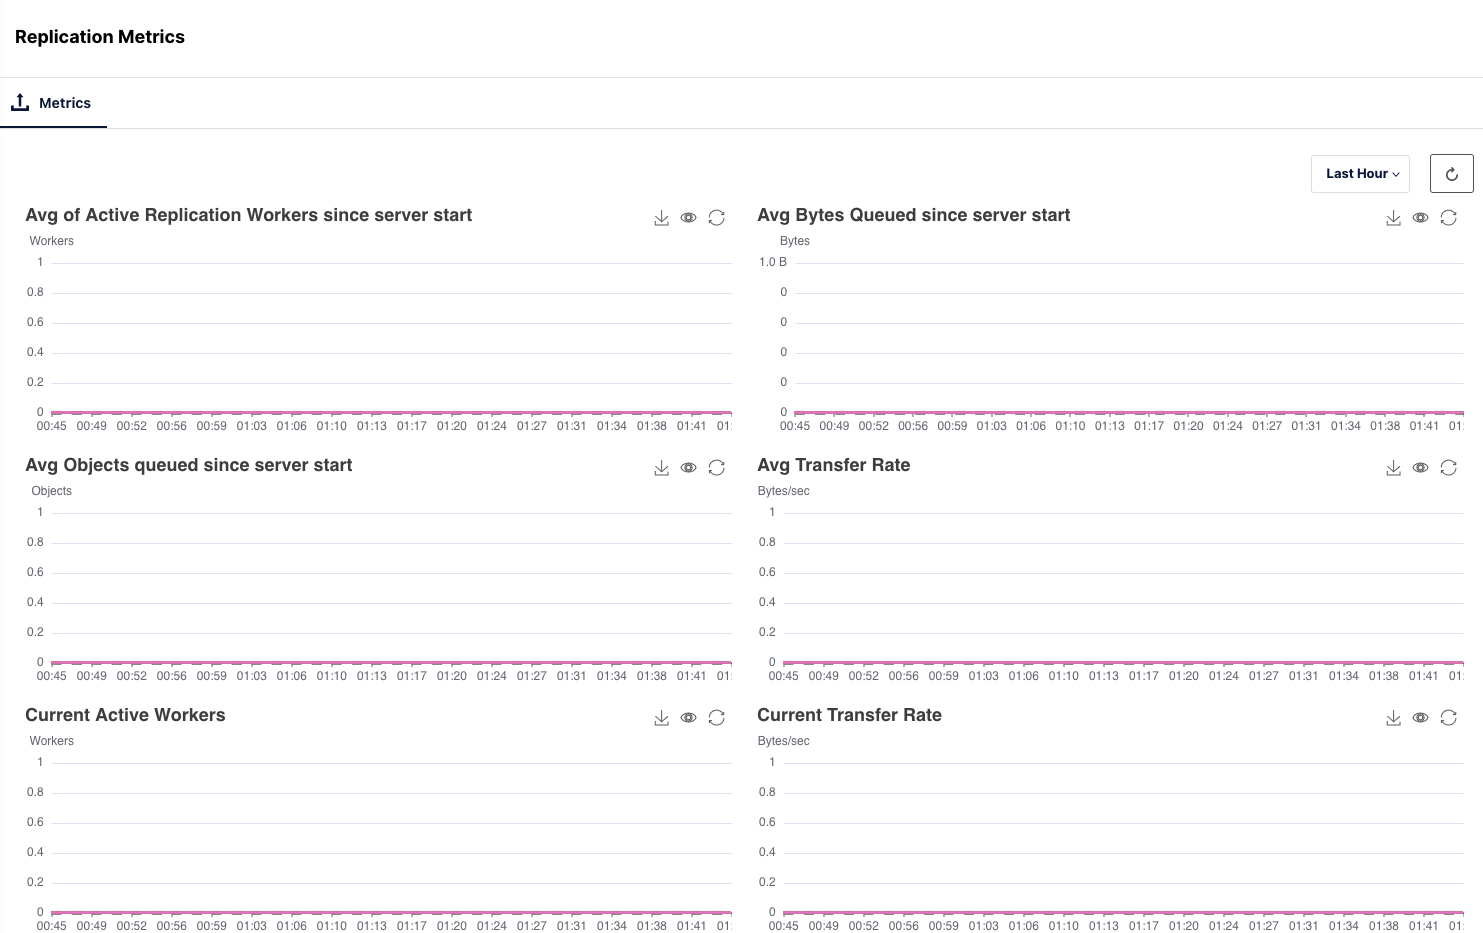
Replication
MinIO includes several ways to replicate data so you can choose the best methodology to meet your needs. We’ve already blogged about bucket based active-active replication for replication of objects at a bucket level and Batch Replication for replication of specific objects in a bucket which gives you more granular control.
Whether it is Site Replication or Bucket Replication, the number of active replication workers and their queues should be monitored to ensure there is no backlog of objects that are piling up to transfer the data to the remote sites. This helps you keep track of and see alerts when the backlog grows too big and if replication slows down.
This is where you will see a backlog of replication.
Scanner
Scanner is a MinIO-specific debugging tool that monitors and repairs objects across the system. Scanner provides the metadata information required for the cluster to report on the total amount of data and objects that are managed by the system.
Debugging
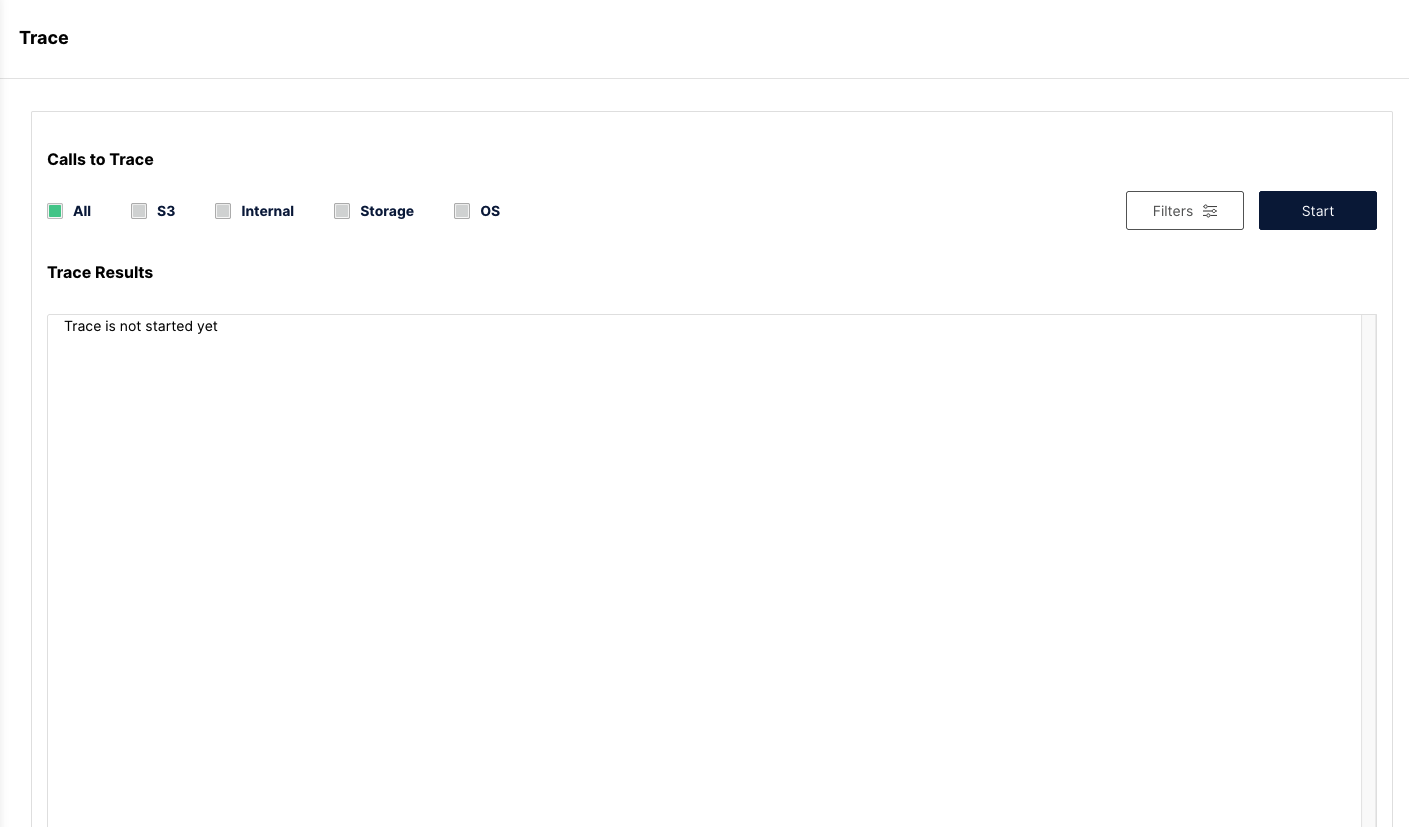
Trace
Tracing is the term used to describe the activity of recording and observing requests made by an application, and how those requests propagate through a system. When systems are set up in a distributed fashion, we call this distributed tracing as it involves observing the application and its interactions through multiple systems. For example, as a developer your code probably includes multiple API calls, but you are more interested in how long the MinIO functions take to execute and the interdependency of those functions as they are used in the application. Tracing will give the necessary insights by:
- Identifying performance and latency bottlenecks
- Finding root cause analysis after major incidents
- Determining dependencies in multi-service architecture
- Monitoring transactions within your application
Live traces show how applications behave. They look at internals call by call to determine the breakup and flow, how much time each call took, how many bytes were transferred, what was the exact operation, success/failure. Traces allow the operations teams to quickly understand if there is a problem in the system and then dig down into root cause analysis. For example, if the application times out, one can quickly determine that the culprit was a slow drive. There is also a live trace tool for live testing.
Summary
Now DevOps teams can be storage experts even though they have no clue how object storage runs. They have all the tools they need – a single pane of glass shows a data center in the US east has a failing drive. The IT team sees this in their generic hw dashboards and DevOps sees it in MinIO. You take this step when you are serious about maintaining your data infrastructure. But don't get us wrong, this is not an IT tool. This is a data infrastructure tool, not a low level storage tool.
With any infrastructure, especially critical infrastructure as storage, it’s paramount the systems are monitored with reasonable thresholds and alerted on as soon as possible. It is not only important to monitor and alert but also do trending for long term analysis on the data. For example, let's say you suddenly notice your MinIO cluster using up tremendous amounts of space, would it be good to know whether this amount of space was taken up in the past 6 hrs or 6 weeks or 6 months? Based on this you can decide whether you need to add more space or prune existing inefficiently used space.
We build everything with simplicity and scale in mind, we're dedicated to minimalist purpose built software tools. We built and supported MinIO. You get this packaged in MinIO Enterprise Observability. Observability is remarkably simple because we removed the complexity for you. Instead of collecting tons of excess data, we just collect important data – it's storage efficient storage monitoring. The system is lightweight and easy to use because we only collect the data we need and then pinpoint anomalies for you. You do not customize, you simply enjoy our opinionated interface.
____
Another way to think about it is that the compliance team wants a little detail for many years whereas the operations team wants massive amounts of detail for a few weeks. MinIO’s observability feature provides the latter because generic solutions cannot because they do not understand data infrastructure well. MinIO’s solution is built for the operations use case - with extreme granularity. The granularity and detail saves the Ops team time and resources, and reduces downtime.
You might be wondering, “why would I use something like Observability over Prometheus and Grafana?” With Prometheus and Grafana you have multiple components that you need to orchestrate and configure in order to make things work. You must first send the metrics/data to Prometheus and then connect to Grafana to visualize the data. That’s just one example – there are certainly a lot more moving parts to the Grafana ecosystem. With Enterprise Observability, both the data store and the visualization components are bundled together, just like MinIO.
So what are you waiting for? If you have any questions on MinIO Enterprise Object Store Observability be sure to reach out to us on Slack or hello@min.io!