MLflow Tracking and MinIO

Introduction
It’s challenging to keep track of machine learning experiments. Let’s say you have a collection of raw files in a MinIO bucket to be used to train and test a model. There will always be multiple ways to preprocess the data, engineer features, and design the model. Given all these options, you will want to run many experiments. Iterating repeatedly through the first 5 steps of the pipeline shown below is a big part of machine learning. Without proper tracking, you will have no way to tell which data wrangling technique and model design were used to get a particular result. Furthermore, you should track results regardless of where you run your experiments. This could be a notebook running on a laptop or a cluster used for distributed training.

This post introduces MLflow Tracking - a component of MLflow designed for logging and querying machine learning experiments. The code download for this post can be found here.
A Quick Introduction to MLflow
MLflow is an open-source platform designed to manage the complete machine learning lifecycle. As a tool for managing the complete lifecycle, MLflow contains the following four components.
- MLflow Tracking - An engineer will use this feature the most. It allows experiments to be recorded and queried. It also keeps track of the code, data, configuration and results for each experiment.
- MLflow Projects - Allows experiments to be reproduced by packaging the code into a platform agnostic format.
- MLflow Models - Deploys machine learning models to an environment where they can be served.
- MLflow Model Registry - Allows for the storage, annotation, discovery, and management of models in a central repository.
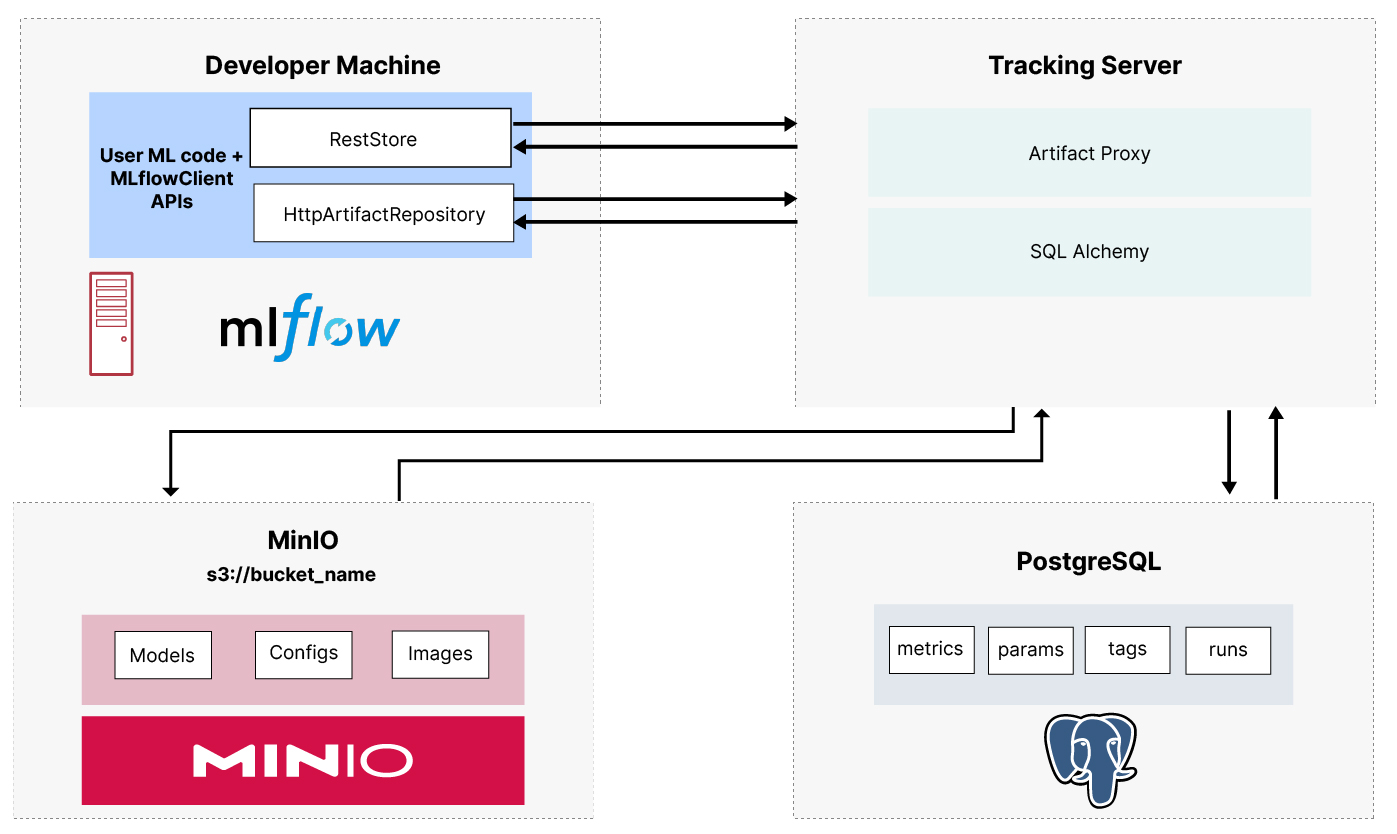
This post will investigate MLflow Tracking. I’ll assume you already have MLflow installed on your development machine as a remote server using PostgreSQL and MinIO. If you do not have MLflow installed, check out my post on Setting up a Development Machine with MLflow and MinIO. In my setup post, I showed how to use Docker Compose to run the services shown below.
The MLflow Tracking API
Before writing any code, it is helpful to get a high-level understanding of what is possible. Below is a list of the most commonly used tracking APIs with their most used parameters. For each API, I have provided a short description. Additionally, I have also categorized them based on whether they are used for setup, logging parameters, metrics, or artifacts. The complete list of APIs can be found in the MLflow API documentation.
Setup
The setup APIs connect to your MLflow server and are also used to start runs and associate them with an experiment. MLflow, like other MLOps tools, defines a run as a single pass through your code. I like to think of a run as one trip through the first 5 steps of the pipeline shown above, which starts with raw data and ends with a tested model. An experiment is a collection of runs with a common goal. Let’s say you want to figure out the optimal learning rate or which loss function is better. These are examples of two experiments that would have multiple runs. Give your experiments and runs meaningful names to help you understand the goal of the experiment and what changed for each run. The APIs for setting up experiments require a name when they are called. When you start a run using mlflow.start_run(), you do not need to pass it a name. This API will generate a name for you. The generated names are quite creative and funny - so if you want a laugh, let MLflow name your runs.
Below are the four setup APIs we will use in this post.
Connects to an instance of the MLflow server. If you do not call this API then everything will be saved to your local file system under a directory called `mlruns`.
Sets an experiment as the active experiment. All runs started after this API is called will be logged to the experiment specified. If the experiment does not exist, then it will be created. Our usage in this post will require this parameter to keep things simple.
Starts a new run. If a run_name is not passed then a creative funny one will be created for you.
Ends the current run.
Parameters
Parameters are anything you can change that impacts the accuracy of your model. Learning rate, number of epochs, and the size of a hidden state are all examples of parameters. I like to put all my parameters into a single dictionary and use the `mlflow.log_params()` api to log everything with one call. Below are the two APIs for logging parameters.
Logs a single parameter.
Logs a batch of parameters. The parameters must be packaged into a dictionary.
Metrics
Metrics are any type of result. The most common metrics are the results of the loss function while training an epoch and the accuracy of your model against a test set. There are two APIs for logging metrics.
Logs a single metric. Notice the optional `step` parameter. This parameter is intended to be used within an epoch loop to allow a single metric to be tracked across the epochs. The most common example is the loss metric.
Logs a dictionary of metrics.
Artifacts
Artifacts are any large file that you wish to save as a part of a run. This could be your raw input files, metadata about your input files, or the trained model itself. There are two APIs for metrics.
Logs a single file as an artifact.
Logs all files in a given directory as artifacts.
This function is specific to models. Since we are using Pytorch our function will be mlflow.pytorch.log_model(). Do not use log_artifact to log a model. Once a model is logged using log_model, it can then be registered with the Model Registry.
The final thing to note about these APIs is that MLflow does have an auto logging feature. This is the result of direct integration with various frameworks. Support varies based on the framework you are using and not all frameworks are supported. I am not going to use auto logging in this post. I prefer to be explicit about everything I log - and the truth is it is not hard to utilize. The APIs above are easy to use, and if you are instrumenting an existing code base, you will find yourself replacing print statements that you may have sprinkled throughout your code to send information to a terminal window.
We are now ready to instrument our code with these APIs. Let’s introduce our data and create a training set and a test set.
The MNIST Dataset
The Modified National Institute of Standards and Technology (MNIST) dataset is a collection of handwritten digits. It is one of the most well-known datasets in the ML community, and it is commonly used as an introduction to building neural networks. Each image is a 28 x 28 pixel image of a hand written number between 0 and 9. Below are a few samples of each number in the dataset. The creators of this dataset have already designated the images to be used for training and testing. There are 60,000 images for training and 10,000 for testing.
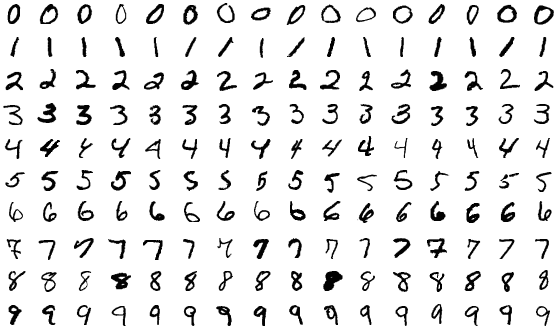
It is easy to get an accuracy better than 90% with this dataset as each image is the same size and the digit is centered. So, for fun, we will see how close we can get to a perfect model - 100% accuracy.
Pytorch has some built-in utilities to load this dataset easily. The function below will create a DataLoader for the training set and a DataLoader for the test set.
Notice that I am not doing any logging within this function, but I am returning metrics that I will log from a controlling function that calls this code. Specifically, I am returning the size of the training set, the size of the test set and the time it took to load these images.
This code will also load the raw MNIST data to a folder under the current working directory named `mnistdata`. I will later log this entire folder as an artifact.
Let’s create our model next.
The Model
The code for the model is below. When we instantiate this class to create our model, the input size must be 784 since that is the number of pixels in each image. The output size must be 10 since this is a classification problem and the model must calculate 10 probabilities for each image. (The probability that this image is a 0, a probability that the image is a 1, ...) The highest probability is the prediction. The hidden sizes are parameters that can be experimented upon.
This is a simple three-layer neural network with a ReLU activation. Some experiments that could be performed with the model itself are increasing the number of layers, changing the sizes of the hidden layers and changing the activation function.
We have data, and we have a model. Next, we need a training function.
Model Training
Below is the training function that will take us through our epochs.
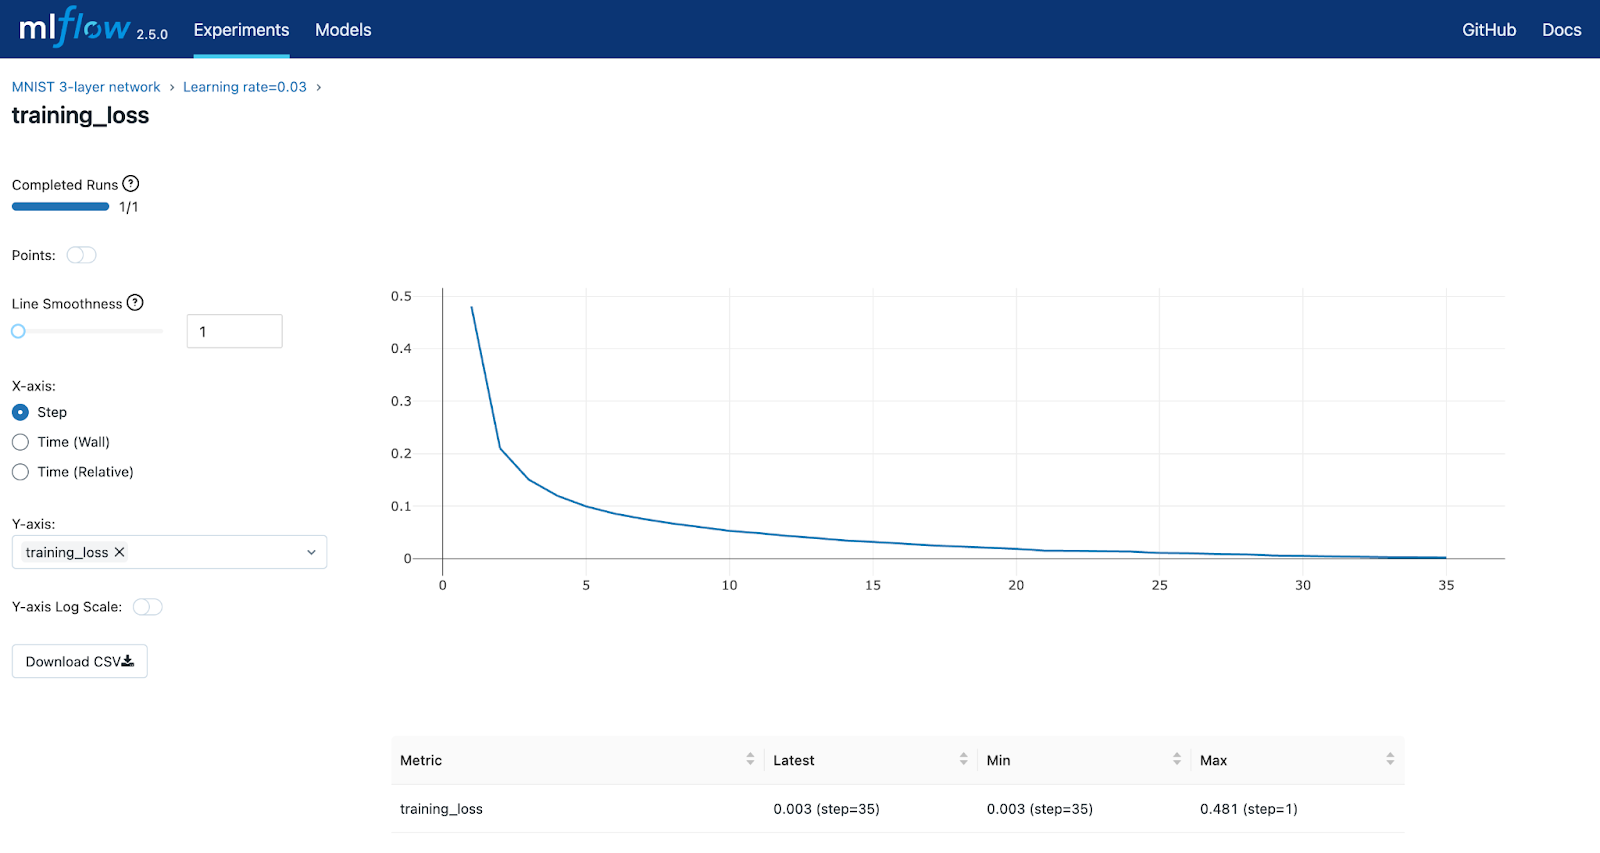
Pay special attention to how the loss is logged after each epoch. The `mlflow.log_metric()` function has an optional parameter for specifying the epoch. This allows us to create a single metric - training_loss - that will contain an array of values. When we look at this metric in the MLflow UI, we will be able to see a nice graph of this metric over all epochs. I’ll show this graph when we explore MLflows UI.
Let’s put everything together and log some metrics.
Putting it All Together
The code below will pull everything together. This is where we make heavy use of the APIs listed above. They are all used in the controlling code below.
Setup occurs first - we connect to our server, create an experiment and start a run. From there, parameters are created and logged. Metrics from loading, training and testing are logged. (The `test_model` function can be found in the github code repo for download. It was omitted here for brevity.) Finally, I logged the model and raw data (this goes to MinIO).
How did we do? Using the code presented in this post, I was able to get 98.2% accuracy against the test set. However, what is more interesting than the result is the metrics collected during all my experiments. Let’s take a look at them now via the MLflow UI.
Exploring the MLflow UI
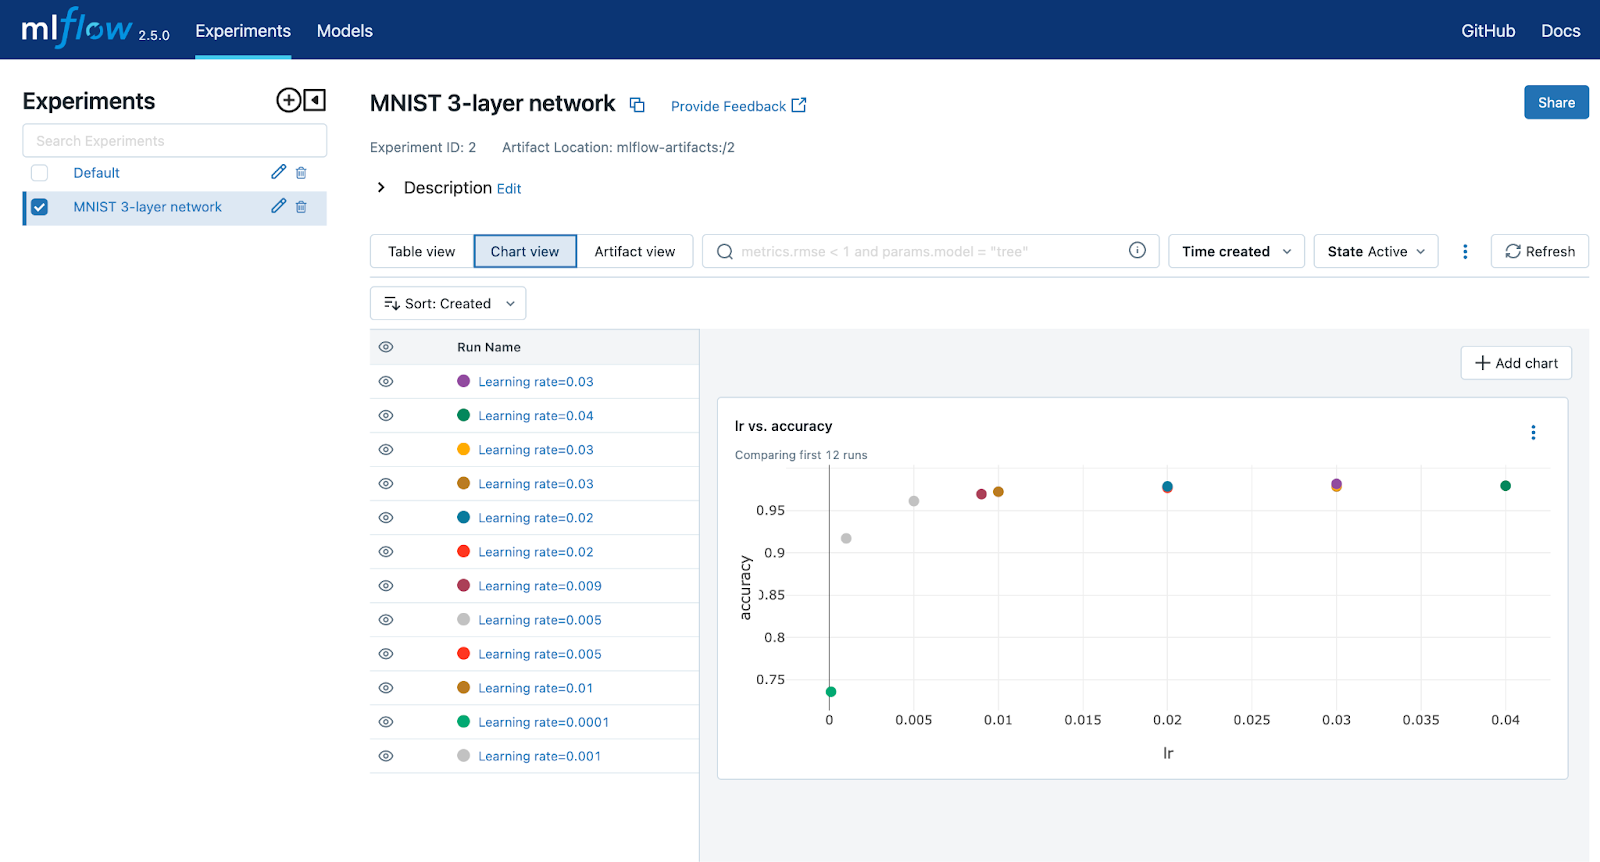
I ran several runs using this model. I was interested in determining the best learning rate. I also wanted to know the optimal number of epochs. After several runs were completed, my MLflow home page looked like the screenshot below.
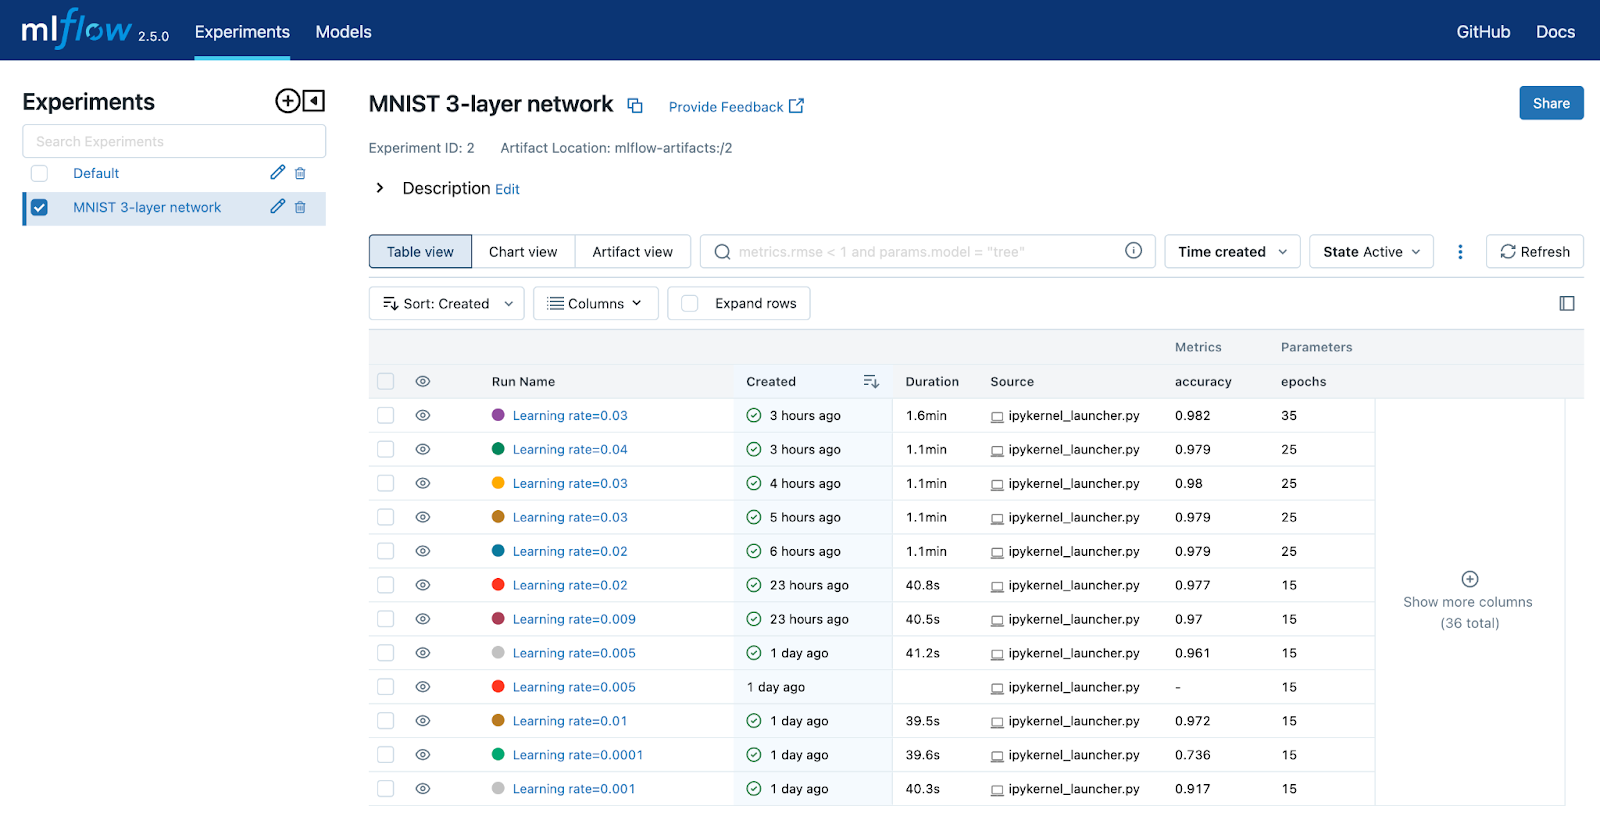
The default view is the table view. You can pick the columns that are displayed. From here, you can drill into a specific run if you want to view its parameters and metrics. Selecting a run and clicking on the `training_loss` metric will produce the graph below. As you can see, it looks like the loss function starts to level off around 35. Additional epochs would not produce better results.
Going back to the home page and clicking on the Chart view button takes you to a page where you can create charts. I created a chart that shows the relationship of learning rate to accuracy. You can create as many charts as you wish. These charts will show the relationship of whatever parameter and metrics you chose across runs within the experiment.
Finally, we get to the artifact view. Artifacts can be saved for every run if you wish. Models should be saved with every run. Eventually, you will have a model that performs well and you will want to register it in MLflows Model Registry. It needs to be logged for you to do this. Consider logging datasets for every run if feature engineering and data wrangling techniques are being applied. Eventually, your datasets will get to the point where they are not changing between runs, in which case you do not have to log the datasets anymore. MLflow provides a way to get the URI from a logged artifact. This allows you to use datasets from previous runs.
Once you select the Artifact view, you must choose the run you wish to investigate. After selecting a run, you will see the page below. This view is showing both the dataset (mnistdata) and the model (mnistmodel). Models are treated differently from data. Models can be placed in MLflows Model Registry - I’ll cover this in a future post.
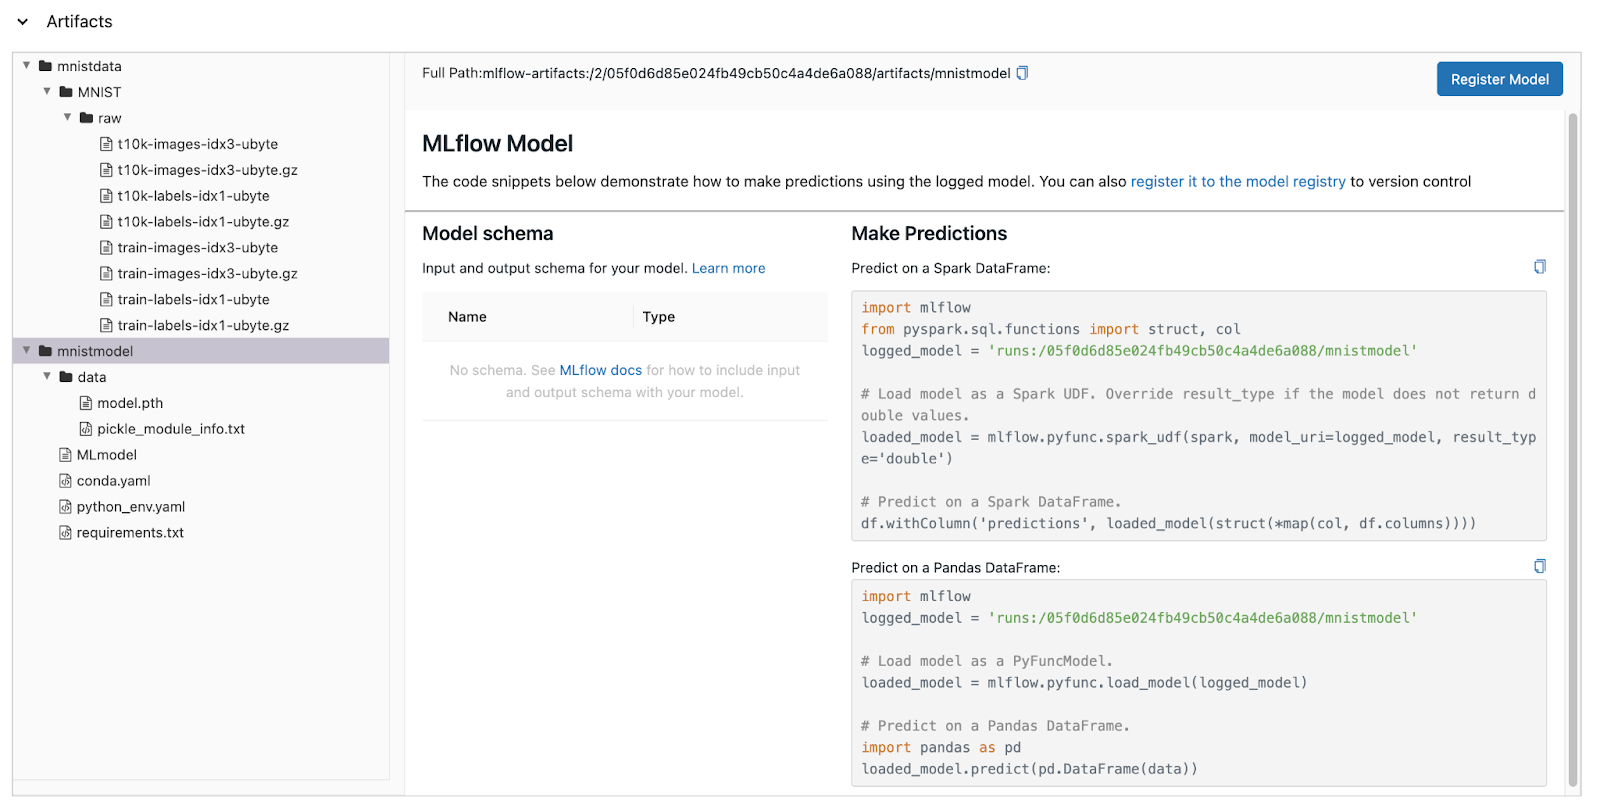
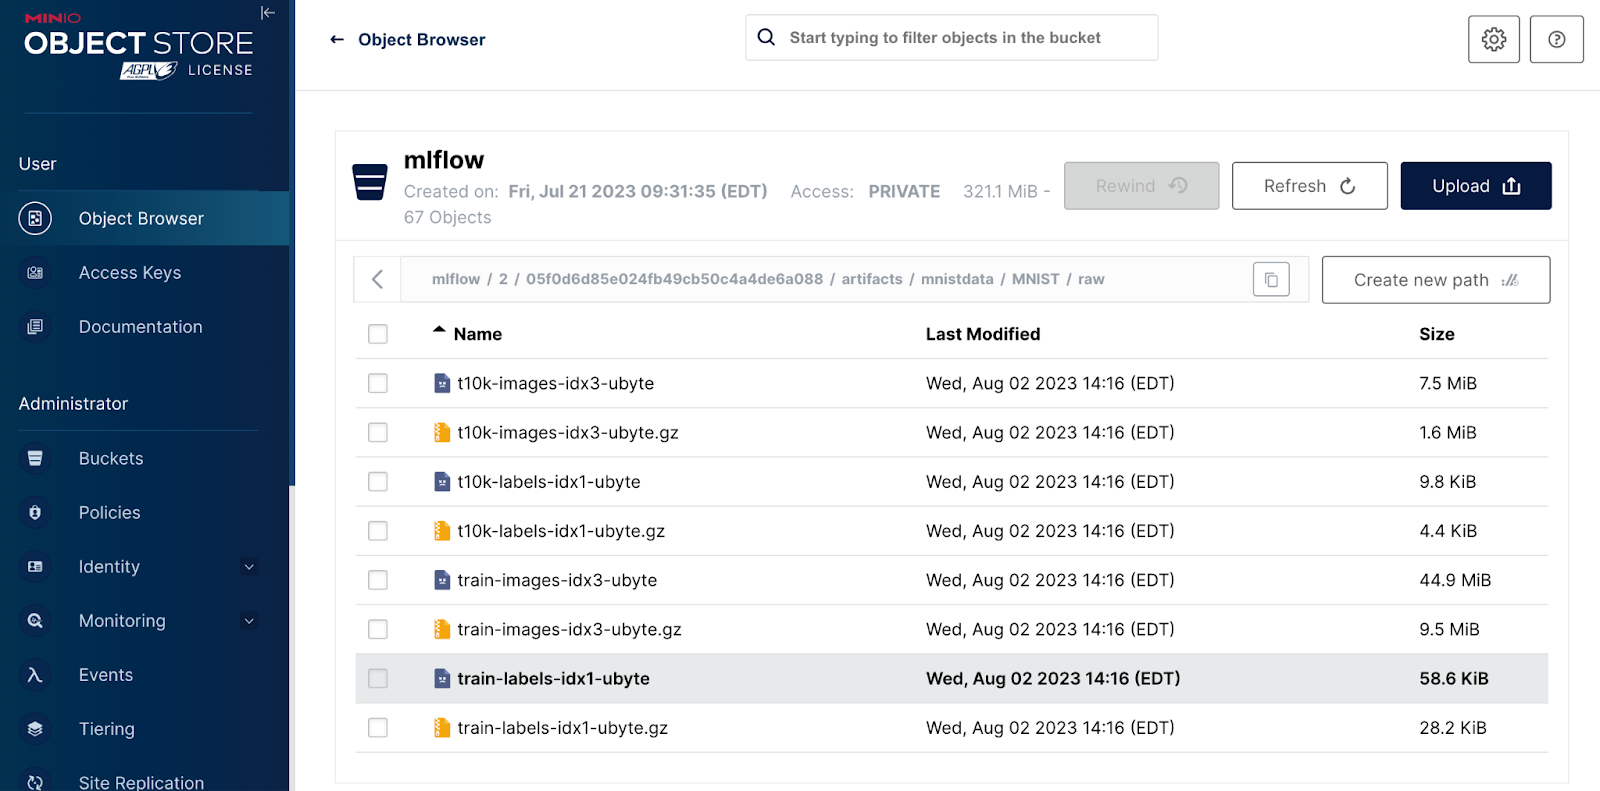
The `Full Path` property is a clue as to where to find this artifact in MinIO. Remember that when we installed MLflow we set up a single bucket within MinIO to be used by MLflow. This bucket was named `mlflow`. Let’s look at the contents of this bucket via the MinIO UI. This is shown below.

Here we see where our model is stored in MinIO. The `mnistmodel` portion of the path is the `artifact_path` that was specified when log_model was called. It is interesting to note that a three-level neural network results in a model that is almost 0.5 MB in size. This is why you need MinIO Object storage within your machine learning workflow. In a production environment, the model will need to be stored reliably and served efficiently. MinIO’s GETs/PUTs results exceed 325 GiB/sec and 165 GiB/sec on 32 nodes of NVMe drives and a 100GbE network. Also, as your models get larger, they will take longer to load - using MinIO will improve load times.
Finally, note the `mnistdata` path. This is the raw data that we logged using `mlflow.log_artifacts()` with an artifact_path of `mnistdata`. The compressed objects you see here are the files that Pytorch downloaded for us.
Summary
MLflow Tracking is an easy-to-use tool for tracking (or logging) parameters, metrics, and artifacts. In this post, we used the MNIST dataset to demonstrate parameter tracking, metric tracking and artifact tracking. We also explored the MLflow UI’s reporting capabilities where we saw a lot of useful reports that could be used for improving model performance. Finally, we looked under the hood and showed how MLflow uses MinIO for storing artifacts.


